- Across six counties and three years, 33.6% of listings ended without a sale. But only 18.5% of houses never sold. A fifth of addresses were listed more than once, and 41% of failed listings were at an address that sold under a later one.
- Sellers who succeed open at almost exactly the same place everywhere. 4.0% to 5.6% above the price per foot the market was actually paying — in all six counties, across 94,203 sales.
- Sellers who fail are where the counties separate. From 5.6% over market in Tarrant to 21.9% in Erath.
- Two things fail everywhere, regardless of county: land and the top of the market. Above twenty acres, 52.6% of properties never sold. Above $1 million, 33.1%.
- A farm or ranch listing is a coin flip. 50.2% never sold.
- Almost every market statistic you read counts listings. That number is roughly double the one that answers the question you are actually asking.
Every market report is built on the houses that sold. That is not a criticism — closed sales are the only transactions with a verified price, and an appraisal has to be developed from them. But it means the published picture of any market is assembled entirely from its successes.
This research does the opposite. It measures 156,400 residential listings across Tarrant, Johnson, Parker, Hood, Wise and Erath counties from October 2023 to October 2026, and the part it is interested in is the 47,727 listings that never sold.
First: almost every failure rate you have read is the wrong one
Of 141,930 listings that reached an outcome, 47,727 ended without a sale. That is 33.6%, and it is the number this kind of analysis normally reports.
It is also misleading, for a reason that took me a while to notice. Those 141,930 listings sat on only 111,808 distinct addresses. Nearly a fifth were listed more than once — a house goes on in spring, expires in autumn, comes back the following year with a different agent and sells. That is one house that sold, and two listings, one of which failed.
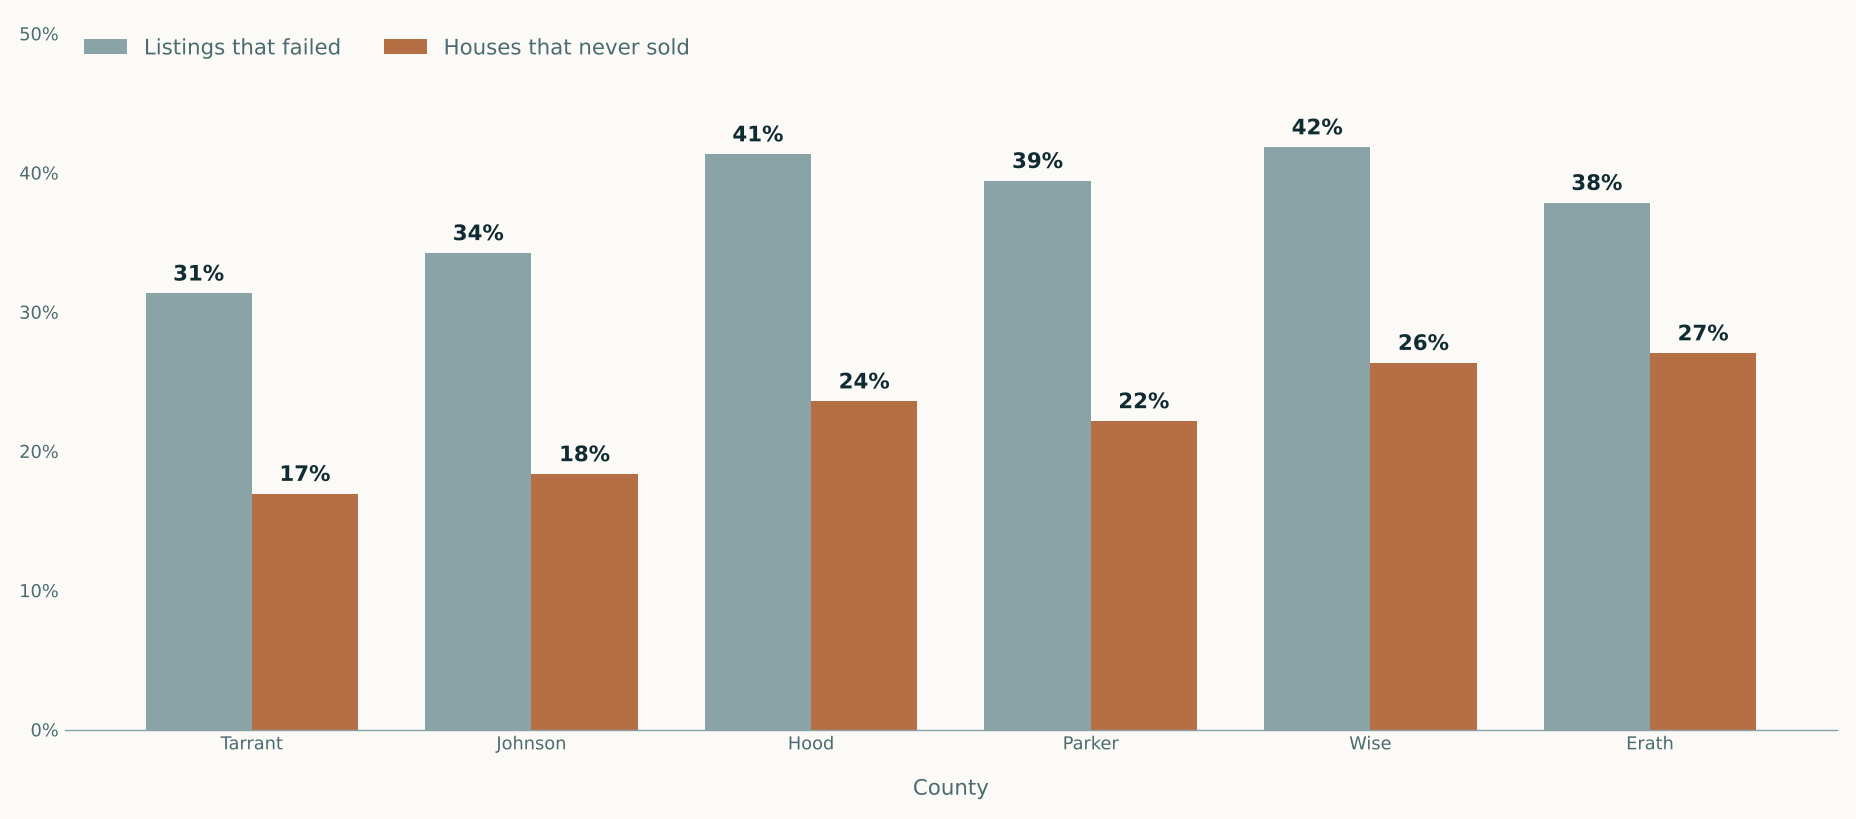
| Measure | Failed | Of | Rate |
|---|---|---|---|
| Listings that ended without a sale | 47,727 | 141,930 listings | 33.6% |
| Houses that never sold at all | 20,714 | 111,808 addresses | 18.5% |
19,537 of the failed listings — 41% — were at an address that sold under a different listing. Those were not houses the market rejected. They were houses whose first attempt did not work.
Both numbers are real. They answer different questions, and the question you are asking is almost never the one the published figure answers:
- Will this listing, at this price, over this period, end in a sale? One in three does not.
- Can this house be sold at all? About one in five could not, over three years.
Everything below is labelled. Where the two measures disagree about which places are weak — and in a couple of cases they do — that is said plainly.
The number that surprised me most
I expected the opening asking price to matter, and to matter differently in different markets. The first half of that was right. The second half was wrong in a way I did not anticipate.
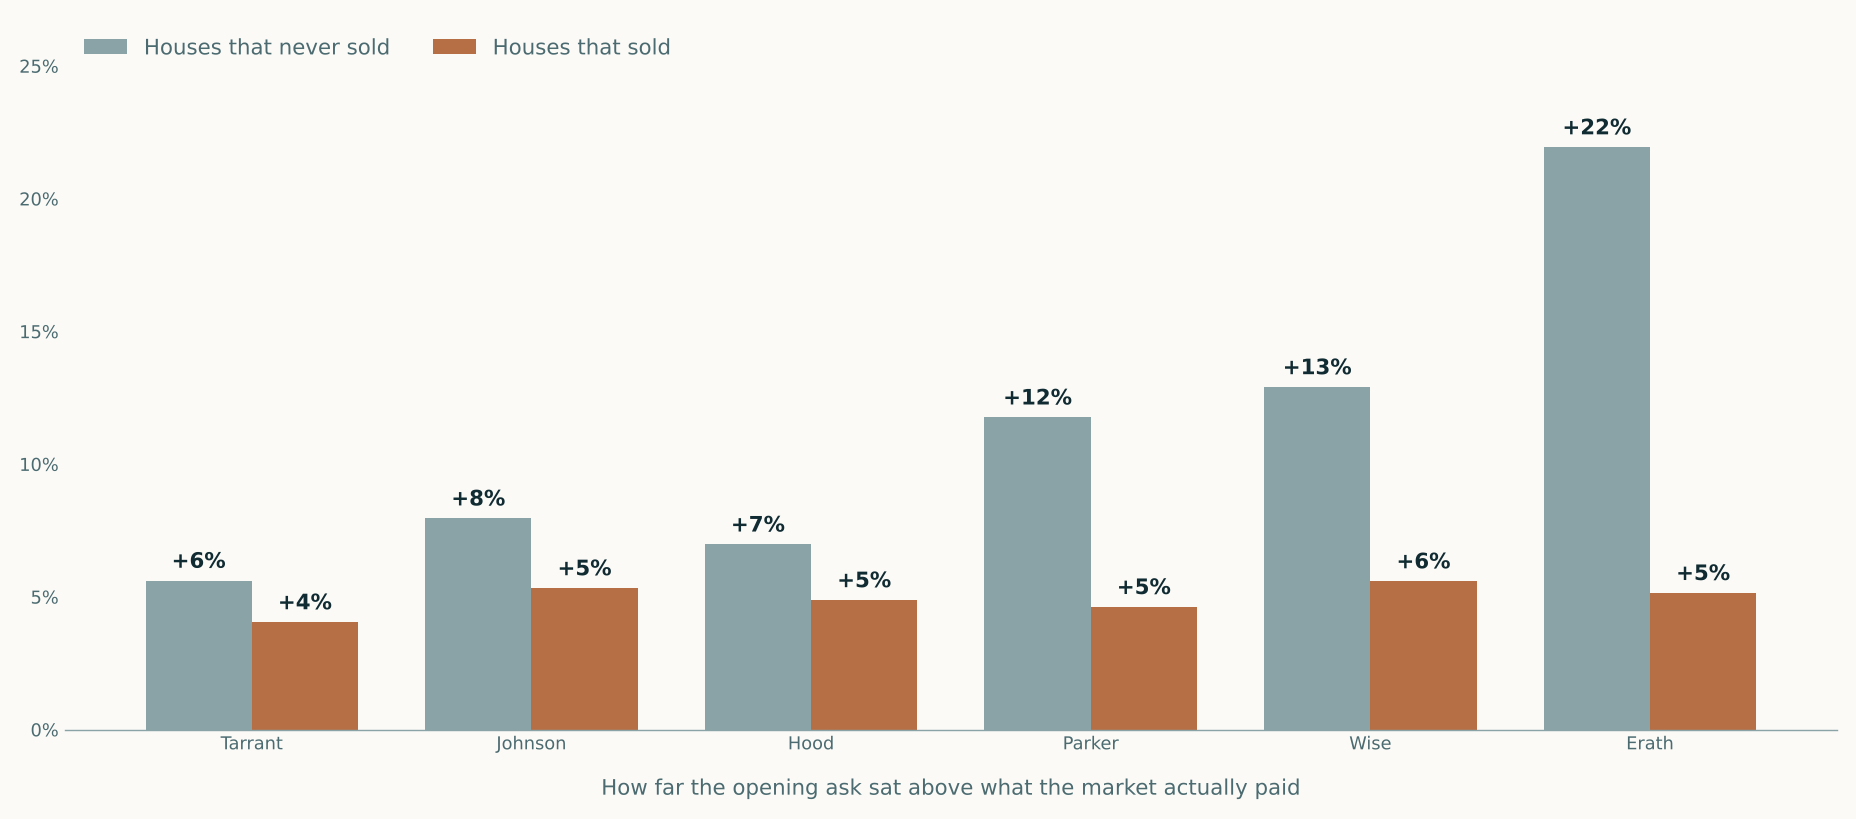
The sellers who succeeded opened at between 4.0% and 5.6% above the price per square foot their market was actually paying — in every single county. Tarrant 4.0%, Parker 4.6%, Hood 4.9%, Erath 5.2%, Johnson 5.3%, Wise 5.6%.
Those are wildly different markets. Tarrant closed 21,880 houses a year at a $345,000 median; Erath closed 448. One is a metropolitan county of two million people, the other is ranch country around a university town two hours west. And across 94,203 successful sales, the opening ask that worked sat in a band a point and a half wide.
That is the most useful single figure in this research. About five percent over market is what a successful opening ask looks like, and it does not appear to depend on where you are.
The failures do:
| County | Closings per year | Sold: opening ask | Never sold: opening ask | Gap |
|---|---|---|---|---|
| Tarrant | 21,880 | +4.0% | +5.6% | 1.6 pts |
| Hood | 1,486 | +4.9% | +7.0% | 2.1 pts |
| Johnson | 3,234 | +5.3% | +8.0% | 2.6 pts |
| Parker | 3,078 | +4.6% | +11.8% | 7.1 pts |
| Wise | 1,274 | +5.6% | +12.9% | 7.3 pts |
| Erath | 448 | +5.2% | +21.9% | 16.8 pts |
The obvious story is market depth — that in a deep market a mispriced house gets corrected quickly because there are enough buyers to find the level, and in a thin one it simply sits. The two extremes fit perfectly: Tarrant is the deepest market and has the narrowest gap, Erath is the thinnest and has by far the widest.
The middle does not fit, and it is worth saying so rather than smoothing it over. Hood County closes half as many houses a year as Parker and has a gap of 2.1 points against Parker’s 7.1. If depth alone drove this, Hood would look like Wise. It does not.
Something other than market size is at work in Hood, and the county-level analysis suggests what: Granbury’s failures are concentrated in segments where price is not the binding constraint — large acreage, the top of the market, and manufactured housing. Where the thing that fails is not priced wrong but unusual, the ask gap stays narrow while the failure rate stays high.
So the honest conclusion is narrower than the clean one: opening price explains a great deal in some markets and very little in others, and knowing which kind you are in matters more than the general advice.
What fails everywhere
Two things fail in every county measured, at every market size, in both counting methods. They are the only findings here that are genuinely universal.
Land
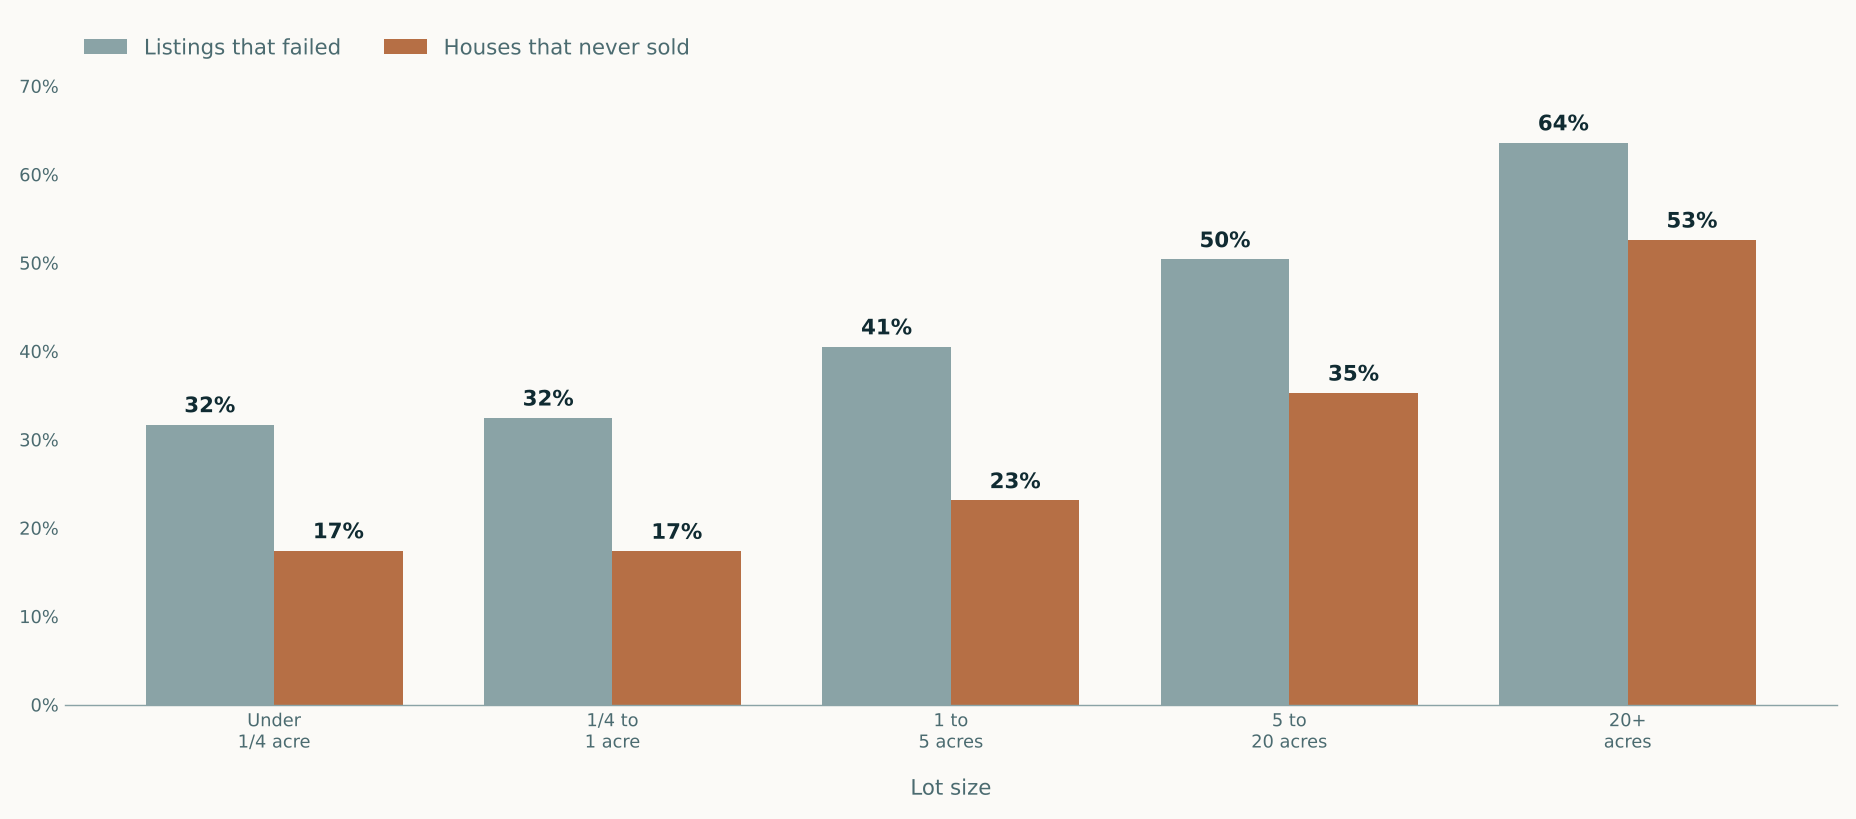
| Lot size | Addresses | Listings that failed | Houses that never sold |
|---|---|---|---|
| Under 1/4 acre | 74,639 | 31.7% | 17.4% |
| 1/4 to 1 acre | 21,039 | 32.4% | 17.4% |
| 1 to 5 acres | 12,544 | 40.5% | 23.1% |
| 5 to 20 acres | 2,503 | 50.4% | 35.3% |
| 20 acres and up | 772 | 63.6% | 52.6% |
Up to an acre, land makes no difference at all — 17.4% either way. Past five acres it becomes the dominant factor, and above twenty acres a majority of properties never sell. Properties classified Farm/Ranch failed 50.2% of the time.
The top of the market
| Asking price | Addresses | Listings that failed | Houses that never sold |
|---|---|---|---|
| Under $250,000 | 16,002 | 33.3% | 22.3% |
| $250,000–500,000 | 69,567 | 31.0% | 17.6% |
| $500,000–1,000,000 | 23,486 | 37.3% | 21.8% |
| $1 million and up | 5,683 | 48.9% | 33.1% |
A third of everything asked above a million never sold. The most liquid band in North Texas is $250,000 to $500,000, and below $250,000 the rate rises again — the cheapest housing is often the oldest and the hardest to finance, and the two effects compound.
Combine the two findings and you get the property most likely to end up unsold: a large tract above a million dollars. That is also the property with the fewest closed sales available to support a price, because so few of its peers ever close. The comparable grid for such a property is drawn from a small minority of attempts that worked, and it contains no visible record of the ones that did not. That is not an argument against using comparable sales. It is an argument for knowing what the sample you are looking at has already excluded.
A warning about new-construction markets
One pattern is worth isolating, because it will corrupt any analysis that does not account for it.
Production builders list, expire and relist the same spec house repeatedly. In Johnson County, listings held by a builder’s own brokerage averaged 2.19 listings per address against 1.24 for everyone else. In the Johnson County portion of Cresson, 482 listings covered just 145 addresses — one appeared eighteen times — producing a listing failure rate of 80.9% against a property failure rate of 36.6%.
Nothing was wrong with those houses. A listing ran its term, expired, and a fresh one went up with a new number. But a report counting listings would describe that subdivision as a market collapse, and anyone valuing a property there off that figure would be badly wrong.
Any analysis of a new-construction submarket that does not group listings by address will be wrong in the same direction every time, and the error is largest exactly where the new construction is heaviest.
The six counties
| County | Listings | Addresses | Listings that failed | Houses that never sold | Closings per year |
|---|---|---|---|---|---|
| Tarrant | 95,596 | 76,374 | 31.3% | 16.9% | 21,880 |
| Johnson | 14,755 | 11,536 | 34.2% | 18.4% | 3,234 |
| Parker | 15,243 | 11,500 | 39.4% | 22.2% | 3,078 |
| Hood | 7,599 | 5,643 | 41.3% | 23.6% | 1,486 |
| Wise | 6,573 | 5,024 | 41.8% | 26.4% | 1,274 |
| Erath | 2,164 | 1,764 | 37.8% | 27.0% | 448 |
Each county page carries its own analysis — seasonality, subdivisions, property types and the local data-quality traps. A few of the findings there are specific enough to be worth naming here: a Hood County listing that began in July failed 49.9% of the time against 38.9% in November; Parker County splits almost two to one across the I-20 corridor, Willow Park at 15.4% against Brock at 40.6%; and pre-1950 Tarrant County housing failed 24.9% of the time against 15.1% for 1990s stock.
What to do with this
If you are selling: about five percent over supportable value is what the opening asks that worked looked like, in all six counties. If you are on acreage, above a million dollars, or both, the base rate is against you and the comparable sales will not show you that.
If you are advising sellers: the failure rate you quote should be the property rate, not the listing rate, unless you mean the listing rate and say so. The two differ by eleven to eighteen points.
If you are valuing property: every comparable grid is a sample of the successes. In the $250,000 to $500,000 band that sample covers 82% of attempts and the distortion is small. On a twenty-acre tract it covers 47%, and the sales you can see are not a neutral picture of what that market will bear.
And if someone quotes you a market failure rate without saying whether it counts listings or houses — it is worth asking, because they may not know there is a difference.
Common questions
What percentage of houses don't sell?
Across 156,400 residential listings in six North Texas counties from October 2023 to October 2026, 33.6% of resolved listings ended without a sale — 47,727 of 141,930. But those listings sat on only 111,808 distinct addresses, and 18.5% of those addresses never sold at all. The difference matters: 41% of failed listings were at an address that sold under a different listing. The listing rate answers whether a particular listing will end in a sale; the property rate answers whether a house can be sold at all.
How much over market value can you list a house for?
Across 94,203 sales in six counties, the houses that sold opened at between 4.0% and 5.6% above the price per square foot their market was actually paying — a band about a point and a half wide, holding across markets as different as Tarrant County with 21,880 closings a year and Erath County with 448. Houses that never sold opened anywhere from 5.6% over market in Tarrant to 21.9% in Erath.
Is it harder to sell a house on acreage?
Substantially, past about five acres. Measured across six North Texas counties, 17.4% of properties on under an acre never sold, rising to 23.1% on one to five acres, 35.3% on five to twenty acres and 52.6% above twenty acres. Properties classified Farm/Ranch never sold 50.2% of the time. Up to one acre, lot size makes no measurable difference to whether a house sells.
Do expensive houses take longer to sell?
They fail more often, which is a different thing. Across six counties, 33.1% of properties asked above $1 million never sold, against 17.6% in the $250,000 to $500,000 band — the most liquid part of the North Texas market. Below $250,000 the rate rises again to 22.3%, because the cheapest housing is frequently the oldest and the hardest to finance.
Why do market reports disagree about failure rates?
Usually because they count different things. A rate computed from listings counts a house that expired and later sold as both a failure and a success; a rate computed from addresses counts it once, as a sale. Across six counties the two measures differ by eleven to eighteen points. The error is largest in new-construction submarkets, where production builders relist the same spec house repeatedly — in one subdivision, 482 listings covered 145 addresses and produced an 80.9% listing failure rate against a 36.6% property failure rate.
Does the month you list a house matter?
It varies by market and the effect is real where it exists. In Hood County, listings that began in July failed 49.9% of the time against 38.9% for November, an eleven-point spread measured only on listings that had at least twelve months to resolve. In Tarrant County the spread is narrower, from 28% for January and February listings to 36% in July. In both cases the summer months are the weakest to begin a listing, which runs against the common assumption about selling season.
- North Texas Real Estate Information Systems (NTREIS) residential listing records for Tarrant, Johnson, Parker, Hood, Wise and Erath counties, 17 October 2023 to 15 October 2026. 156,400 unique listings after de-duplication, of which 141,930 resolved — 94,203 sold and 47,727 expired, cancelled or withdrawn. Listings still active at the end of the period are excluded from every failure rate.
- The listing rate is the share of resolved listings that came off the market without selling. The property rate groups listings by street number, name, suffix, unit and city, counting an address as sold if any of its listings closed; 19.8% of addresses carried more than one listing. Addresses entered inconsistently across listings would be counted as separate properties, which pushes the property rate up rather than down.
- Sold listings are counted on close date and unsold listings on status-change date, so both sides of every rate cover the same span.
- Opening ask comparisons use median original list price per square foot against median closed price per square foot, excluding records with no usable living area.
- Lot sizes are derived from the MLS square-footage field rather than the acreage field, which is frequently populated with the square-foot figure — the error rate ranges from 1.4% of listings in Erath County to 13.2% in Johnson.
- Figures are aggregate. No individual listing, address, price, client or agent is identified, and confidential listing remarks were excluded from the dataset entirely.
Market statistics describe past transactions in aggregate and are not an opinion of value for any particular property. Nothing here is an appraisal. Data supplied by NTREIS and believed reliable but not guaranteed; NTREIS does not warrant it and it may not reflect all market activity. Figures as at the date of publication.