- Appraisal district
- Hood County Appraisal District, West Pearl Street, Granbury
- Cities and communities
- Granbury, Tolar, Lipan, DeCordova, Pecan Plantation, Oak Trail Shores, Indian Harbor, Canyon Creek
- Lake
- Lake Granbury impounds the Brazos River; the Brazos River Authority permits docks, retaining walls and shoreline work
- Pecan Plantation
- About 2,200 acres on De Cordova Bend, built around a preserved two-runway airstrip; a small portion lies in Johnson County
- Groundwater
- Wells regulated by the Upper Trinity Groundwater Conservation District
- Property types I appraise
- One-to-four unit residential and residential land only
What the Hood County market actually did, 2023–2026
Everything below is measured from 8,570 Hood County listings on 5,643 addresses — every residential listing in the MLS over three years, whether it sold or not. That second half matters more than it sounds, and it is the part most market reports leave out. A report built only on sales describes the houses that succeeded.
- Sales are up 17% in two years. 1,353 closings, then 1,519, then 1,586.
- And price per foot went down while that happened — $190, $188, $186. More transactions, slightly cheaper.
- It takes longer. Median cumulative days on market went from 55 to 73.
- 41.3% of listings ended without a sale — but only 23.6% of houses never sold. A quarter of Hood addresses were listed more than once. The difference between those two numbers is the whole story of this market.
- Overpricing explains very little of it. The listings that failed opened at $201/sqft. The ones that sold opened at $197. Two percent apart.
- What does predict it: the month, the lot, and the price tier. A July listing failed 50% of the time. A November listing, 39%.
- Waterfront changes the price and not the odds. And the gated communities do worse than they look.
| 12 months ending | Sold | Never sold | Failure rate | Median price | $/sqft | CDOM |
|---|---|---|---|---|---|---|
| October 2024 | 1,353 | 887 | 39.6% | $335,000 | $190 | 55 |
| October 2025 | 1,519 | 1,198 | 44.1% | $350,000 | $188 | 67 |
| October 2026 | 1,586 | 1,055 | 39.9% | $346,750 | $186 | 73 |
Read that as a market absorbing more inventory by taking longer and giving up a little price, which is what you would expect with 30% of closings built in 2023 or later. New supply is clearing. It is not clearing at a premium.
The failure column above, and every failure rate on this page unless labelled otherwise, counts listings. The section below explains why that is not the same as counting houses, and gives both.
Two ways to count a failure, and why it matters
Across three years, 7,599 Hood County listings reached an outcome. 3,141 of them ended without a sale — 41.3%.
But those 7,599 listings sat on only 5,643 distinct addresses. A quarter of them — 25.3% — were listed more than once. A house goes on in spring, expires in autumn, comes back the following year with a new agent and sells. That is one property that sold and two listings, one of which failed.
Count properties instead of listings and the picture changes completely:
| Measure | Failed | Of | Rate |
|---|---|---|---|
| Listings that ended without a sale | 3,141 | 7,599 listings | 41.3% |
| Houses that never sold at all | 1,331 | 5,643 addresses | 23.6% |
Of the 3,141 listings that failed, 1,248 — 40% — were at an address that sold under a different listing. They were not houses the market rejected. They were houses whose first attempt did not work.
Both numbers are real and they answer different questions. If you are asking will this listing, with this agent, at this price, over this period, end in a sale, the answer is 41.3% of the time it does not. If you are asking can this house be sold at all, the answer is that 23.6% did not sell in three years.
Most published market statistics quietly report the first and let readers hear the second. Everything below this point is labelled, because the two diverge more than anyone expects — and in one case further down, they point in opposite directions.
The failures are not mainly about price
Everywhere else I have measured this, the listings that fail are the ones that opened too high. In a study of 114,946 listings, failure rose steadily with the opening ask. In Erath County, the listings that never sold asked 18% more per foot than the market was paying.
Hood does not behave that way.
| Group | Opening ask, $/sqft | Against achieved |
|---|---|---|
| Listings that sold | $197 | +5% |
| Listings that never sold | $201 | +7% |
| Actually achieved | $188 | — |
A two percent difference in opening ask between the houses that sold and the houses that did not. That is not nothing, but it is nowhere near enough to explain a 41% failure rate.
The behaviour afterwards is more revealing. The sellers who failed cut their price more often and further than the sellers who succeeded — a median 2.5% off the opening ask against 0.6%, and only 37% of failed listings never cut their price at all against 49% of the ones that sold. They were not stubborn. They reduced, and it did not save them.
Which means the standard advice — price it right and it will sell — is necessary in Granbury but visibly not sufficient.
The month you list changes the odds by eleven points
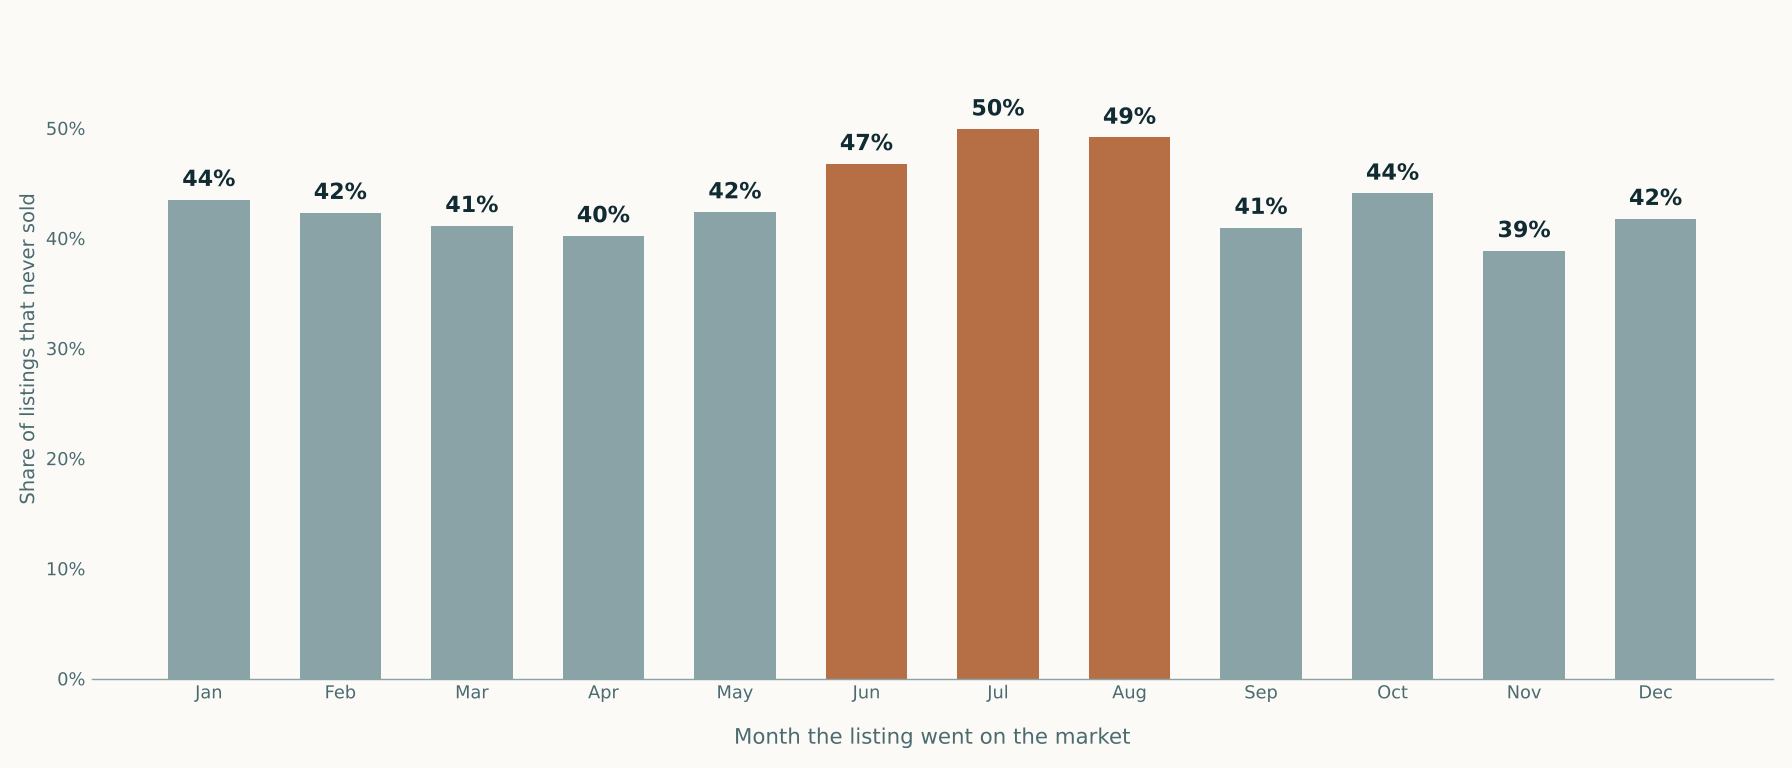
A Hood County listing that went on the market in July failed 49.9% of the time. One that listed in November failed 38.9%. Same county, same houses, eleven points of difference in outcome depending on the month the sign went in the yard.
June, July and August are the three worst months to start. April and November are the two best. This runs against the folk wisdom that summer is selling season — and in a lake market, the explanation is probably that summer is when the inventory arrives, not when the buyers do. Everyone lists in summer, the competition is at its peak, and the listings that do not stand out sit until they expire.
If you are choosing between going on in July and waiting until September, the data says wait.
Lot size, and a word about where this number comes from
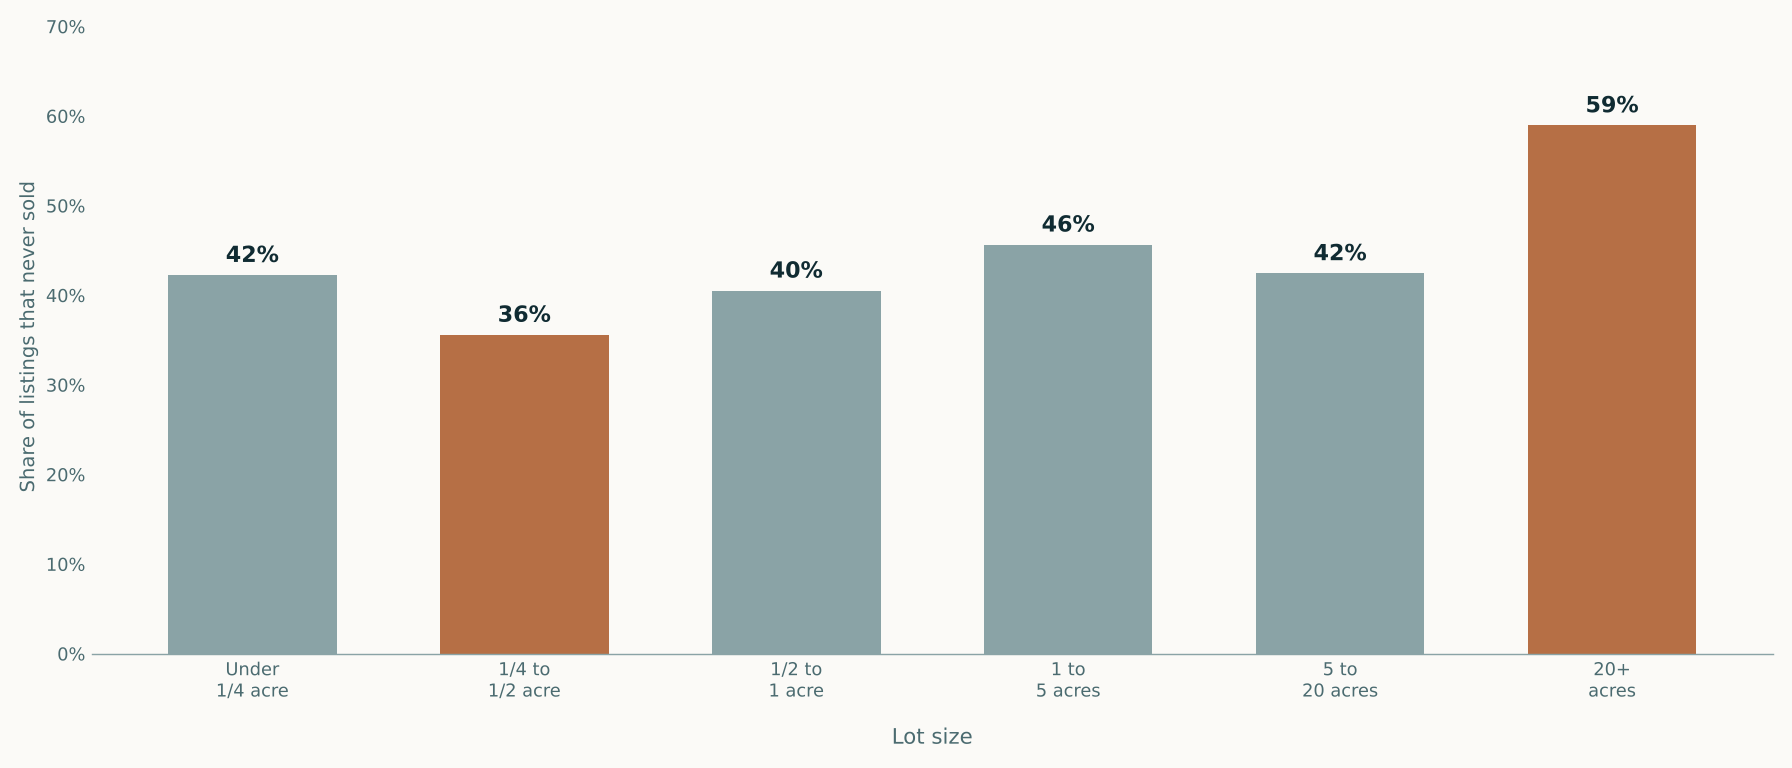
The sweet spot is a quarter to a half acre, failing 35.6%. Go above an acre and the failure rate climbs to 45.6%; above twenty acres it reaches 58.9% on a median sold price of $1.1 million. Large acreage in Hood County is a genuinely illiquid asset, and anyone valuing it off a handful of closed sales is looking at the small minority of attempts that worked.
These figures are calculated from the MLS square footage lot field, not the acreage field. In Hood County the acreage field is frequently populated with the square-foot figure instead — a lot entered as “165,092 acres” is 165,092 square feet, or 3.79 acres. In this dataset 6.6% of rows carry that error. Anyone computing Hood County lot statistics without checking will produce numbers that are wrong in a direction they cannot see, and valuations drawn from them inherit the error.
Price tier, and the top of the market
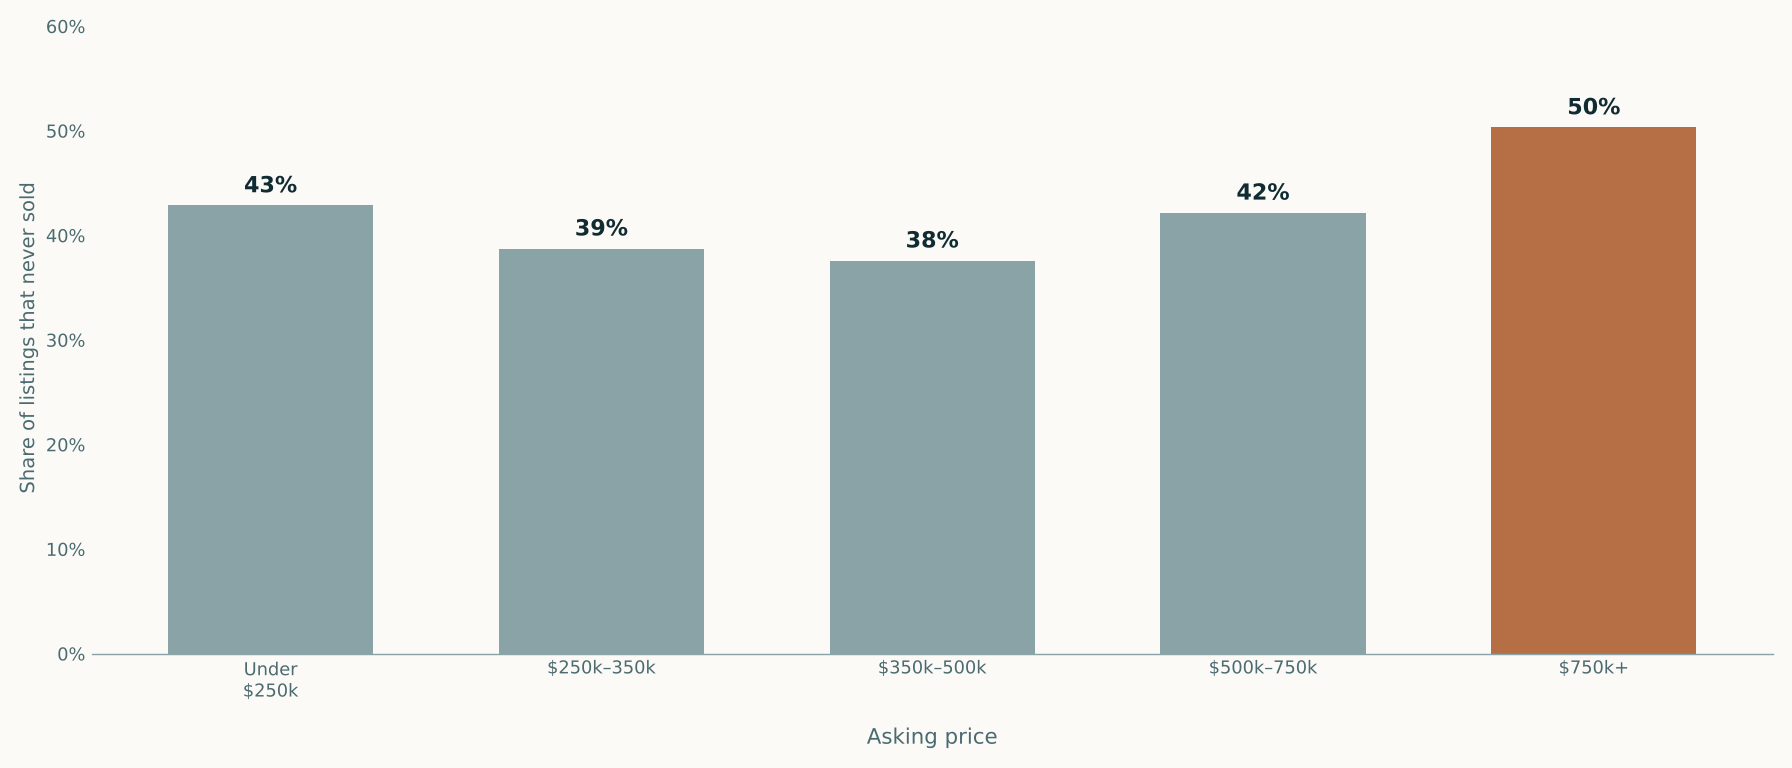
Half of everything asked above $750,000 never sold. The most liquid band is $350,000 to $500,000, failing 37.6%. Below $250,000 the rate climbs again to 42.9%, which is largely a property-type effect — manufactured homes alone failed 51.8% of the time.
For an owner at the top of the market this is the number worth sitting with. Above $750,000 in Hood County, a coin flip is the base rate, and the comparable sales available to support a price at that level are a filtered sample of the attempts that succeeded.
Where in Granbury, and the thing about waterfront
Here the two measures start disagreeing, so both are shown. Subdivisions are listed where at least sixty addresses resolved.
| Subdivision | Addresses | Listings that failed | Houses that never sold | Median sold |
|---|---|---|---|---|
| Abe’s Landing | 79 | 6.1% | 2.5% | $448,991 |
| Sandstone Estates | 66 | 19.7% | 13.6% | $384,490 |
| Canyon Creek V | 101 | 41.1% | 16.8% | $272,000 |
| Saratoga | 61 | 32.4% | 18.0% | $339,740 |
| Pecan Plantation | 503 | 34.5% | 19.1% | $435,000 |
| Canyon Creek | 245 | 40.9% | 22.4% | $290,000 |
| Treaty Oaks | 72 | 32.9% | 23.6% | $253,990 |
| DeCordova Bend Estates | 183 | 34.4% | 24.0% | $369,000 |
| Comanche Cove Sec C | 83 | 38.8% | 25.3% | $238,000 |
| Comanche Cove Sec A | 69 | 46.5% | 26.1% | $239,500 |
| Tolar Oaks | 79 | 30.7% | 26.6% | $265,000 |
| Canyon Creek III | 158 | 48.5% | 28.5% | $280,000 |
| Western Hills Harbor | 68 | 58.1% | 38.2% | $235,750 |
The spread runs from Abe’s Landing, where 2.5% of houses failed to sell, to Western Hills Harbor at 38.2% — fifteen times the rate, inside one county.
Notice also that the two columns do not rank the same. Canyon Creek V looks mediocre on listings at 41.1% and is one of the best places in the county on houses at 16.8%: sellers there relist and get it done. Tolar Oaks looks good on listings at 30.7% and is middling on houses at 26.6%.
Measured by listings, a golf community in Hood County failed 31.1% of the time and a gated community 34.5%, against 41.3% county-wide — an apparently large advantage. Measured by houses, golf communities failed 24.9% and gated 27.1%, against 23.6% county-wide. The advantage does not merely shrink. It reverses. What the amenity communities actually have is fewer relistings, not more sales — which is worth knowing before paying a premium for the covenant.
Waterfront, meanwhile, does nothing to the odds on either measure. By listings, waterfront failed 41.9% against 41.2%. By houses, 25.3% against 23.8%. I expected the lake to be the dividing line in this market and it is not — waterfront changes the price enormously, with a $600,000 median against $325,000, but it does not change whether the house sells.
That is worth stating plainly because it is the single most common assumption made about Granbury, and three years of data do not support it.
What this means if you own a house here
Four things follow from the numbers above, and none of them require hiring anybody.
Do not read the sold comparables as the market. Close to one house in four did not sell at all over three years, and two listings in five ended without a sale. Every comparable sales analysis you will ever be shown — including mine — is drawn from the attempts that worked. That is the correct data to value from, but it systematically describes a friendlier market than the one you are entering.
Time your listing if you have the choice. Eleven points between July and November is a bigger effect than most of what sellers agonise over.
Know which Granbury you are in. Pecan Plantation and DeCordova Bend behave differently from Canyon Creek III, and all three are inside the same city limits and the same appraisal district.
If you are above $750,000 or on serious acreage, get the number before you set the price, not after. Those are the two segments where a failed listing is most likely and where supporting comparables are thinnest — exactly the conditions where an opinion developed from the whole dataset rather than the handful of recent sales is worth having.
Granbury, the lake, and everything past it
Granbury is the county seat, built around a courthouse square that is listed as a National Register historic district, with genuine late nineteenth and early twentieth century housing nearby. Lake Granbury impounds the Brazos River, and the shoreline is long, irregular and heavily subdivided, which is why waterfront submarkets here vary so much within short distances.
Outside Granbury the county includes Tolar, Lipan, part of Cresson, the town of DeCordova, and a set of older lake-oriented subdivisions such as Oak Trail Shores, Indian Harbor and Canyon Creek that were platted on small lots and hold a mix of modest site-built houses and manufactured homes. Those subdivisions do not analyze against Pecan Plantation or against open waterfront acreage, and treating them as a single Granbury market produces bad results.
The rest is rural: acreage tracts, working land, farmsteads and increasingly barndominium-style construction, on private wells and on-site sewage facilities.
Lake Granbury waterfront: the permits are part of the property
Waterfront value on Lake Granbury is not a single premium. Open water frontage, cove frontage, canal frontage, water view without frontage, and deeded water access through a common area are five distinct positions and they sell differently. Water depth at the dock, shoreline orientation and the amount of usable flat area between the house and the water all matter as well.
The Brazos River Authority administers structures on and along the reservoir. Docks and similar facilities over the reservoir bed require an On-Water Facility Permit. Shoreline work, including constructing a retaining wall, dredging the lake bottom under a dock, removing stumps and maintaining a private boat ramp, requires an Improvement Permit. Drawing water for residential use through a pump and pipeline requires its own permit. Construction cannot begin before the permit is approved and returned.
For an appraisal this means the dock and shoreline structures are not simply improvements to be measured. Whether they are permitted, and whether the permits are current and transferable, is part of what a buyer is acquiring. I verify permit status rather than assuming a structure that exists is a structure that is authorized.
Pecan Plantation and gated community valuation
Pecan Plantation is roughly a 2,200 acre development in southeastern Hood County, about twelve miles southeast of Granbury on De Cordova Bend on the west side of the Brazos, downstream of Lake Granbury. A small portion extends east into Johnson County. It grew up around a two-runway cropdusting airstrip, and the runways were preserved, which is why the community includes airpark lots with taxiway access.
Airpark property is a genuine specialty. A house with hangar space and taxiway access to a preserved private runway does not compare to an equivalent house without it, and the buyer pool is different. Hangar construction, door dimensions, taxiway easement rights and the covenants governing aircraft operation all belong in the report. Where I use an airpark comparable I use one with equivalent access, and where I have to reach outside the county for that I say so.
Beyond the airpark, the community includes golf frontage, river frontage and interior lots, plus its own amenities and utilities and a property owners association with substantive covenants. Because a small part of the development sits in Johnson County, the appraisal district and the taxing units are not identical for every property in it, and I confirm which apply at the parcel level.
Acreage, ag valuation, wells and septic
Agricultural valuation is common on Hood County land, and it works the way it does elsewhere in Texas: a productivity-based tax valuation rather than a market value statement, with rollback exposure recapturing the difference when land converts to a non-agricultural use. When a homesite is being split from a larger ag tract, that exposure belongs in the analysis.
Water wells in Hood County fall under the Upper Trinity Groundwater Conservation District, which covers Hood, Montague, Parker counties and administers registration and permitting. Whether a property has a producing well, a shared well, membership in a rural water supply corporation, or municipal service is a marketability question, not a detail.
On-site sewage facilities are permitted under Texas Commission on Environmental Quality rules. Conventional or aerobic, system age, and whether the permit record matches what is in the ground all affect cost and financeability. On lakefront lots, system siting relative to the water is worth attention.
Data, distance and the appraisal district
Hood County Appraisal District, on West Pearl Street in Granbury, appraises property throughout the county. The general Texas protest deadline applies: May 15, or 30 days after the notice of appraised value is delivered, whichever is later. Owners may request an informal meeting before the formal Appraisal Review Board hearing, and the ARB must give written notice of the hearing at least 15 days in advance.
Comparable search here is often wide by necessity. On rural acreage and on unusual waterfront I may search across the whole county and into Somervell, Erath, Parker, Johnson or Palo Pinto, and I state and justify each extension. On a lake property the right comparable may be twelve miles away on similar water rather than half a mile away on a different shoreline configuration.
Floodplain along the Brazos and the smaller drainages varies substantially, and mapped hazard on a large tract may cover land without touching improvements. I check the current effective FEMA mapping for the specific parcel.
Scope and terms
I appraise one-to-four unit residential property and residential land only: single-family houses including lake and airpark homes, houses on acreage, manufactured homes that are real property, and residential and rural residential lots and tracts. I do not appraise commercial property, apartment properties of five units or more, or subdivision development feasibility.
Typical assignments include purchase and refinance lending, pre-listing and pre-purchase valuation, estate and date-of-death appraisals, trust and gifting work, divorce and property settlement, and appraisal district protest support.
My fee is quoted before the assignment begins and does not depend on the value I report or on any outcome. Waterfront, airpark and acreage assignments take longer and cost more than a standard subdivision house, and I tell you that when I quote. Terrence Bilodeau, Texas Certified Residential Appraiser #1360232-CR, (817) 903-4509. Fees start at $500 for a standard single-family home, and turnaround is generally 5 to 7 business days from inspection.
Unique property
“He wasn't late, showed up when he said he would, and got everything done even though it was more difficult since we have a log cabin. He still got everything done quick and in the timeline he gave me.”Daniel Finch · Google review
Common questions
Is my dock included in the appraisal?
It is analyzed, and part of that analysis is whether it is permitted. The Brazos River Authority requires an On-Water Facility Permit for structures over the reservoir bed and an Improvement Permit for shoreline work such as retaining walls and dredging. I verify status rather than assuming an existing structure is an authorized one.
How do you value an airpark home in Pecan Plantation?
With comparable sales of properties that have equivalent taxiway access and hangar facilities, which sometimes means reaching outside Hood County. Hangar construction and dimensions, taxiway easement rights and the covenants governing aircraft operation all go in the report. A comparable without runway access is not a comparable for an airpark home.
Does waterfront always sell for a premium?
Waterfront is not one thing. Open water, cove, canal, water view without frontage and deeded common-area access are distinct positions with distinct markets, and depth, orientation and usable yard all matter. I match on the specific configuration rather than applying a general waterfront adjustment.
My lot has an ag valuation. Does that carry over if I build?
Converting land to a non-agricultural use triggers rollback taxes recapturing the difference for the preceding years. That exposure is part of what a buyer takes on, and I address it in the analysis. Qualification questions go to Hood County Appraisal District.
How far do you travel for an inspection?
Throughout Hood County, including Granbury, Tolar, Lipan, DeCordova and Pecan Plantation. Assignment fees and turnaround reflect distance and property complexity, quoted before I begin. I quote every assignment individually and the quote reflects the drive.
What percentage of Granbury listings actually sell?
It depends whether you count listings or houses, and the two differ sharply. Across the three years to October 2026, 41.3% of resolved Hood County listings ended without a sale — 3,141 of 7,599. But those listings sat on only 5,643 distinct addresses, a quarter of which were listed more than once, and 23.6% of those addresses never sold at all. Of the listings that failed, 40% were at an address that sold under a different listing. The rate varies within the county: by houses, Abe's Landing failed 2.5% of the time and Western Hills Harbor 38.2%, while listings above $750,000 failed 50.3% and those on more than twenty acres 58.9%.
When is the best time to list a house in Granbury?
Measured over three years of Hood County listings, the month a listing begins is associated with an eleven-point difference in whether it ever sells. Listings that began in July failed 49.9% of the time and those beginning in August 49.2%, against 38.9% for November and 40.2% for April. June, July and August are the three weakest months to start, which is the opposite of the common assumption about summer selling season.
Does waterfront make a Granbury house easier to sell?
It makes it more valuable but not more saleable. Over three years, Hood County listings with a waterfront feature failed 41.9% of the time and listings without failed 41.2% — effectively identical. Waterfront listings sold at a median of $600,000 against $325,000 for non-waterfront, so the price difference is substantial while the probability of selling is not.
- Source: North Texas Real Estate Information Systems (NTREIS) residential listing records for Hood County, 17 October 2023 to 15 October 2026. 8,570 listings, of which 7,599 resolved — 4,458 sold and 3,141 expired, cancelled or withdrawn. Listings still active at the end of the period are excluded from failure rates.
- Two failure measures are reported. The listing rate is the share of resolved listings that came off the market without selling. The property rate groups listings by street address and counts an address as sold if any of its listings closed; 25.3% of addresses carried more than one listing. Sold listings are counted on close date and unsold listings on status-change date, so both sides of every rate cover the same span.
- Address grouping uses street number, name, suffix, unit and city as recorded in the MLS. Addresses entered inconsistently across listings would be counted as separate properties, which would push the property rate up, not down.
- The listing-month chart uses only listings that began on or before 16 October 2025, so every listing in it had at least twelve months to resolve.
- Lot sizes are derived from the MLS square-footage field rather than the acreage field, which in Hood County is frequently populated with the square-foot figure; 6.6% of rows in this dataset carry that error.
- Subdivision figures are reported only where at least 80 listings resolved. Figures are aggregate; no individual listing, address, price or client is identified.
Market statistics describe past transactions in aggregate and are not an opinion of value for any particular property. Nothing here is an appraisal. Data supplied by NTREIS and believed reliable but not guaranteed; NTREIS does not warrant it and it may not reflect all market activity. Figures as at the date of publication.