- Appraisal district
- Tarrant Appraisal District (TAD), Fort Worth
- Protest deadline
- May 15, or 30 days after the notice of appraised value is delivered, whichever is later
- Municipalities
- Roughly forty incorporated cities and towns, plus unincorporated area and ETJ
- Housing range
- Pre-1920 urban neighborhoods through subdivisions completing today
- Historic overlays
- Fort Worth uses HC, HSE and DD designations; other cities run their own programs
- Property types I appraise
- One-to-four unit residential and residential land only
What the Tarrant County market actually did, 2023–2026
Measured from 104,532 Tarrant County listings on 76,374 addresses — every residential listing in the MLS over three years, whether it sold or not. This is the baseline every other county in this research is measured against.
- 31.3% of listings failed. 16.9% of houses never sold. Tarrant clears better than every surrounding county.
- Volume is flat and price per foot is falling. 21,832 closings, then 22,124, then 21,684 — while $/sqft went $187, $184, $181.
- Time on market jumped 34% and stayed there. Median CDOM went from 29 days to 40 in a single year.
- Overpricing barely discriminates here. Houses that sold opened 4% over market; houses that failed opened 6% over. The narrowest gap of six counties.
- Above $1 million, 26.7% never sold. It is the only tier that behaves differently.
- Pre-1950 housing fails most — 24.9%. So does 2010–2022 product, at 21.1%, for a completely different reason.
| 12 months ending | Sold | Listings that failed | Rate | Median price | $/sqft | CDOM |
|---|---|---|---|---|---|---|
| October 2024 | 21,832 | 8,467 | 27.9% | $349,000 | $187 | 29 |
| October 2025 | 22,124 | 10,672 | 32.5% | $350,000 | $184 | 40 |
| October 2026 | 21,684 | 10,813 | 33.3% | $345,000 | $181 | 39 |
Sales volume did not move. Everything else did. The failure rate rose five and a half points, price per foot fell 3%, and the median time to contract went from four weeks to nearly six. Tarrant is not shrinking — it is getting harder to transact in.
Worth noting what is not driving it: only 16.5% of Tarrant closings were built in 2023 or later, against 30–40% in Johnson, Wise, Parker and Hood. Whatever is happening here, a building boom is not the cause.
Two ways to count a failure
95,596 listings reached an outcome and 29,956 ended without a sale — 31.3%. Those listings sat on 76,374 distinct addresses, 18.8% of which were listed more than once.
| Measure | Failed | Of | Rate |
|---|---|---|---|
| Listings that ended without a sale | 29,956 | 95,596 listings | 31.3% |
| Houses that never sold at all | 12,941 | 76,374 addresses | 16.9% |
12,535 of the failed listings — 42% — were at an address that sold under a different listing.
At 16.9%, Tarrant County is the most reliable market in this research. Every surrounding county is worse: Johnson 18.4%, Parker 22.2%, Hood 23.6%, Wise 26.4%, Erath 27.0%. If you have read a figure for how often North Texas listings fail, it was almost certainly the listing number from a single county, and it will not describe the metro.
Price explains less here than anywhere
Across six counties, the houses that sold opened at a remarkably consistent price — about 4 to 6% above the price per foot the market was actually paying. The houses that failed are where the counties diverge.
| County | Sold: opening ask vs market | Never sold: opening ask vs market | Gap |
|---|---|---|---|
| Tarrant | +4% | +6% | 2 points |
| Hood | +5% | +7% | 2 points |
| Johnson | +5% | +8% | 3 points |
| Parker | +5% | +12% | 7 points |
| Wise | +6% | +13% | 7 points |
| Erath | +5% | +22% | 17 points |
In Tarrant County the failed listings opened just two points higher than the successful ones. Whatever is causing twelve thousand Tarrant houses not to sell, the opening price is a small part of it.
That is a useful corrective, because pricing is the lever everyone reaches for first. In a deep, liquid market with 21,000 closings a year, a mispriced house gets corrected quickly — buyers are plentiful enough that the price finds its level. What fails in Tarrant fails for reasons that show up in the next three sections: the age of the building, the top of the market, and the land.
The two kinds of house that fail
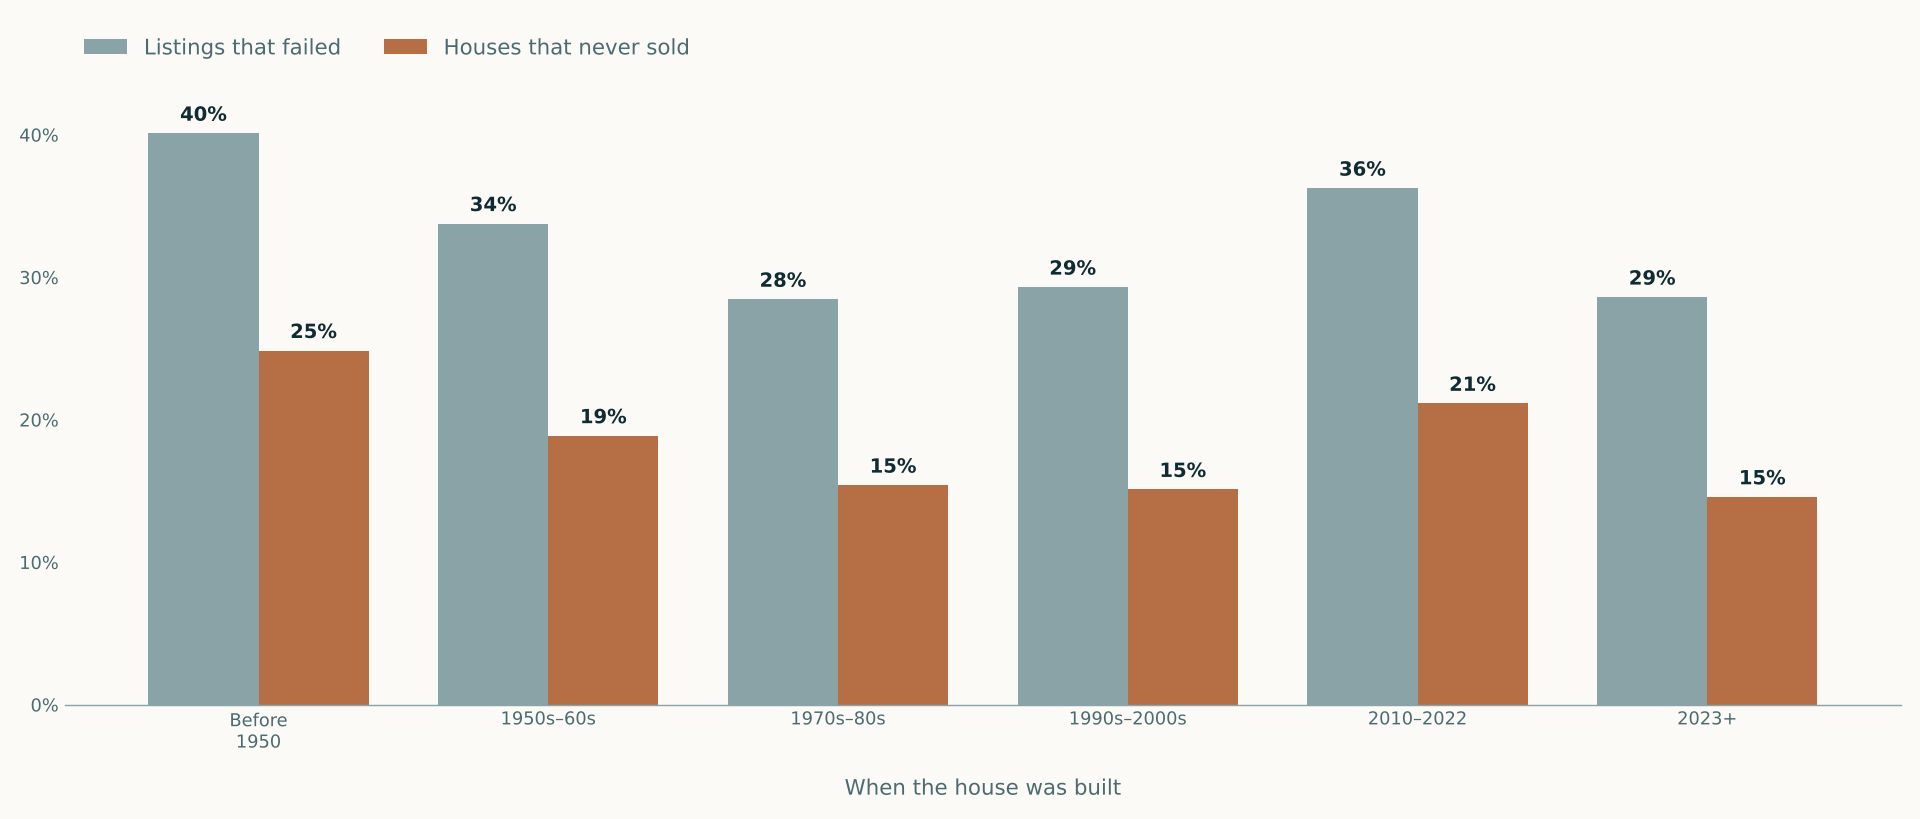
Pre-1950 houses never sold 24.9% of the time, against 15.1% for 1990s and 2000s stock. That is the historic inner-city housing — Fairmount, Arlington Heights, the near Southside, Poly, Riverside — where condition varies enormously house to house and a buyer’s financing options narrow as soon as a lender’s appraiser flags a condition issue. It is also the stock where two houses on the same block can be worth double one another, which makes pricing from neighbouring sales genuinely unreliable.
The second peak is less obvious. Houses built 2010–2022 failed 21.1% of the time, worse than both the older stock around them and the brand-new product. These are the ones competing most directly with new construction: similar layouts, similar finishes, a decade of wear, and no builder incentive behind them. A 2016 house two miles from a 2026 release with a rate buydown is in a difficult position.
Where in Tarrant County
| City | Addresses | Listings that failed | Houses that never sold | Median sold | CDOM |
|---|---|---|---|---|---|
| Bedford | 1,554 | 22.0% | 10.7% | $379,200 | 19 |
| Grapevine | 1,498 | 24.8% | 11.3% | $585,000 | 19 |
| Colleyville | 1,144 | 28.2% | 11.6% | $980,000 | 19 |
| Keller | 1,934 | 25.9% | 12.4% | $665,000 | 20 |
| Watauga | 966 | 24.6% | 12.7% | $285,000 | 24 |
| Hurst | 1,350 | 25.1% | 13.0% | $349,000 | 24 |
| Crowley | 1,850 | 24.5% | 13.1% | $317,250 | 62 |
| Euless | 1,378 | 22.6% | 13.4% | $365,000 | 21 |
| North Richland Hills | 2,689 | 27.2% | 14.2% | $383,855 | 27 |
| Haslet | 1,184 | 29.8% | 14.3% | $584,090 | 82 |
| Mansfield | 2,765 | 28.7% | 14.5% | $445,000 | 40 |
| Arlington | 10,603 | 29.8% | 16.0% | $330,000 | 31 |
| Benbrook | 1,073 | 31.5% | 17.1% | $333,000 | 30 |
| Southlake | 1,344 | 34.2% | 17.6% | $1,346,000 | 20 |
| Fort Worth | 36,040 | 33.9% | 18.7% | $333,990 | 41 |
| Haltom City | 1,143 | 31.1% | 19.0% | $270,000 | 31 |
| Azle | 1,156 | 33.8% | 19.6% | $312,999 | 45 |
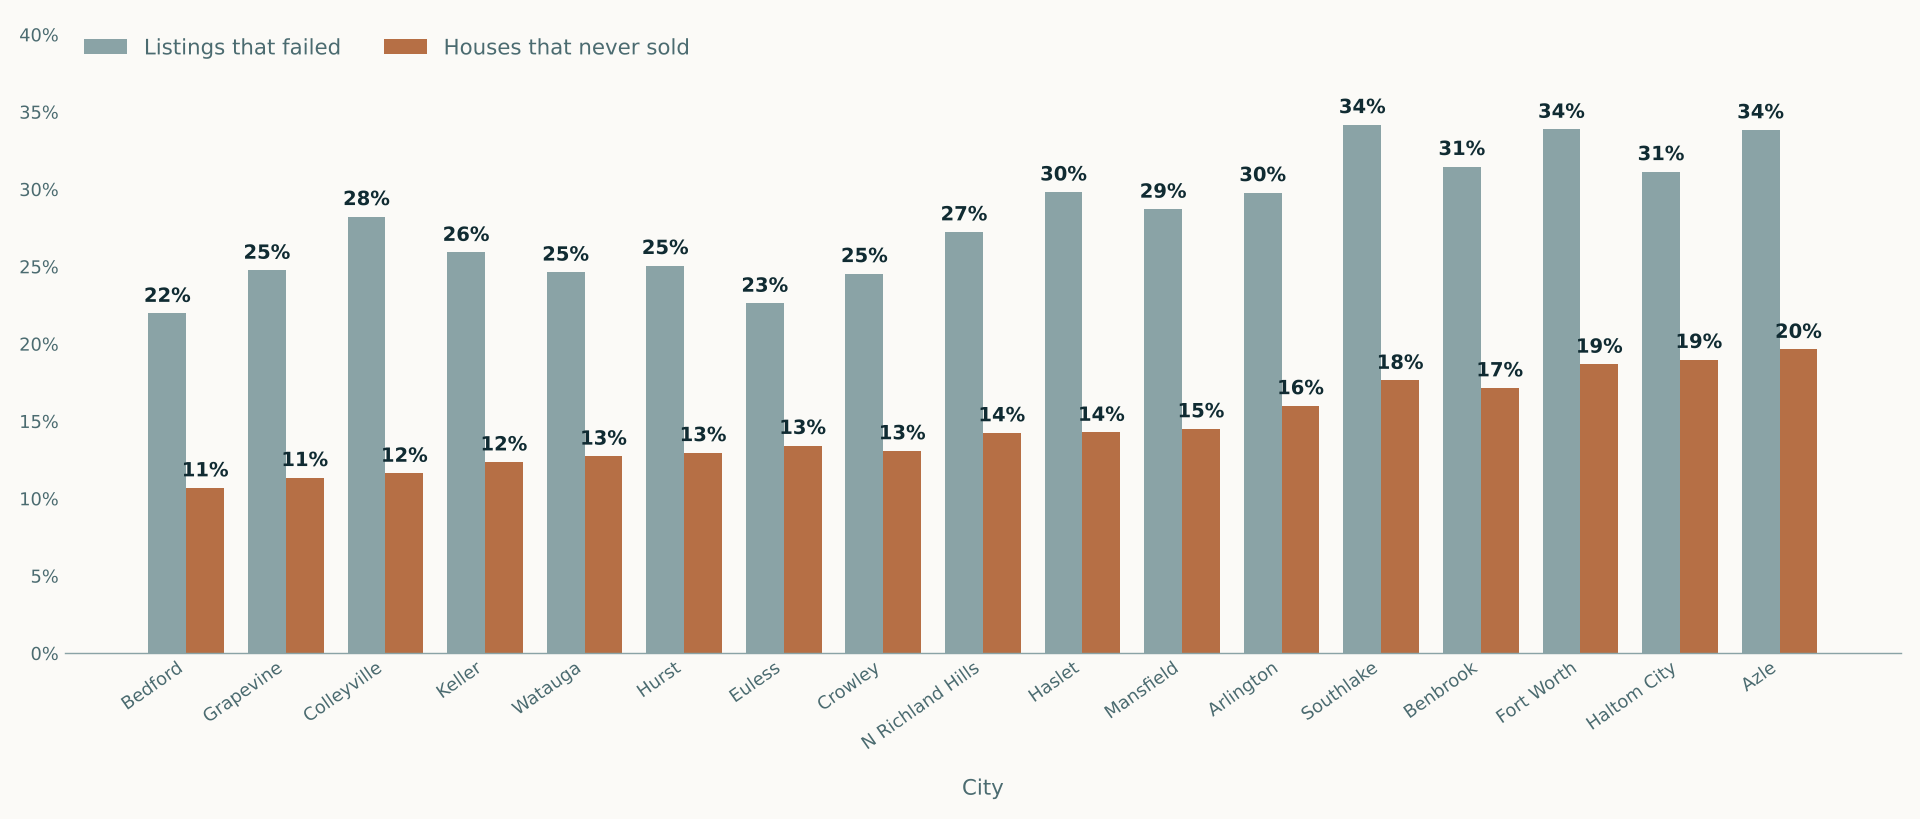
Fort Worth is 36,040 addresses — nearly half the county — and it clears worse than almost all of it, at 18.7%. That is not a judgment about the city; it is what you get when one jurisdiction contains both the pre-1950 stock that fails at 24.9% and the new growth on the edges.
The mid-cities — Bedford, Hurst, Euless, Watauga, North Richland Hills — clear at 11–14% and contract in under four weeks. Built out, uniform, mid-priced and liquid.
Two cities are worth a second look. Southlake fails 17.6% at a $1,346,000 median, which is the price tier effect rather than the location. And Crowley clears at 13.1% but takes a median 62 days — nearly as long as Fort Worth proper at half the failure rate. Haslet is similar at 82 days, which is new-construction release timing rather than weak demand.
Price tier and land
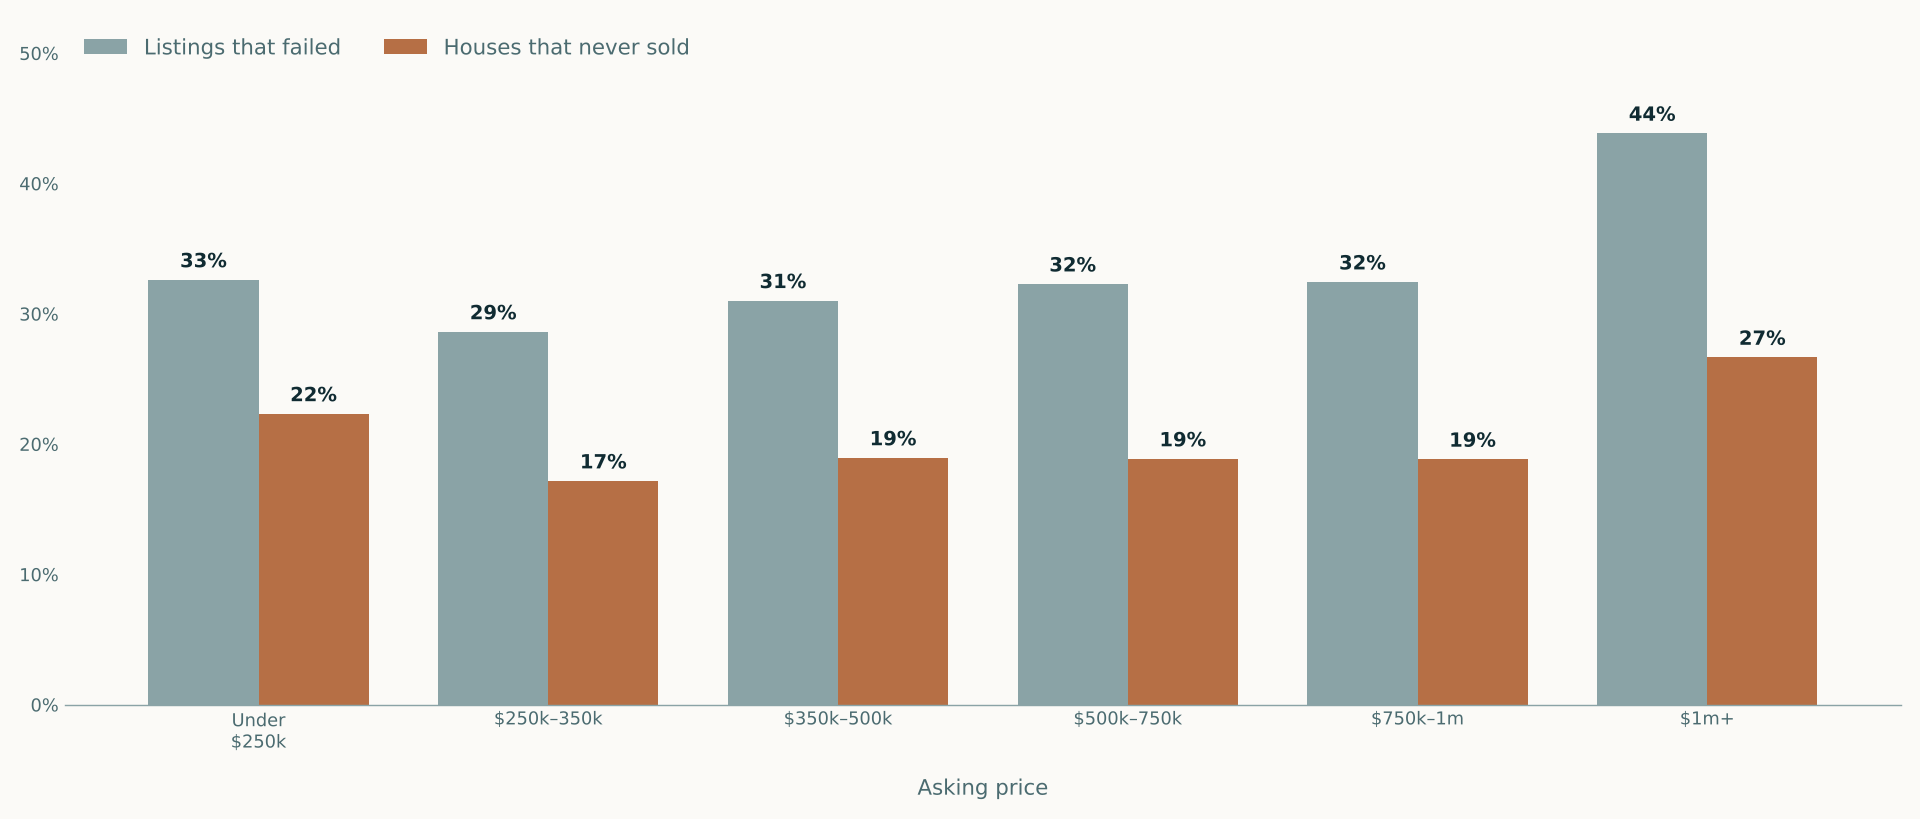
From $250,000 to $1,000,000 the Tarrant market is essentially uniform — 17 to 19% of houses never sell regardless of price. That is unusual and it is what a deep market looks like.
Two places break it. Above $1 million, 26.7% never sold. And below $250,000, 22.3% never sold — the second-worst tier, which surprises people. Cheap houses in Tarrant are frequently the oldest and the hardest to finance, and the two effects compound.
| Lot size | Addresses | Listings that failed | Houses that never sold | Median sold |
|---|---|---|---|---|
| Under 1/7 acre | 25,744 | 32.5% | 18.6% | $322,500 |
| 1/7 to 1/4 acre | 33,780 | 29.4% | 15.8% | $339,000 |
| 1/4 to 1/2 acre | 11,359 | 29.8% | 15.2% | $460,000 |
| 1/2 to 1 acre | 2,510 | 36.7% | 19.6% | $742,550 |
| 1 to 5 acres | 2,374 | 40.7% | 22.2% | $725,000 |
| 5 acres and up | 289 | 54.7% | 38.8% | $730,000 |
Land hurts in Tarrant exactly as it does in the outer counties, just with fewer properties exposed to it. Only 289 addresses sat on five acres or more, and 38.8% of them never sold.
What this means if you own a house here
Tarrant is the easiest market around to sell in, and it got harder over three years. One house in six does not sell, against one in four in Hood and Wise. But the failure rate climbed five points and the median time to contract rose by eleven days while prices fell.
Do not assume price is the problem. Failed Tarrant listings opened two points higher than successful ones. If a house is not selling here, the explanation is more likely to be condition, era, financing or the top of the market than the number on the sign.
If the house predates 1950, the comparable sales are doing less work than they appear to. A quarter of that stock never sells, condition varies more than anything an appraisal grid captures, and two houses on one block can genuinely be worth double one another.
Above $1 million, the base rate is different. 26.7% never sold, against 17–19% across the rest of the market.
One county, dozens of separate housing markets
Tarrant County contains around forty incorporated cities and towns, and they were not built at the same time or to the same standard. Fort Worth alone spans everything from pre-1920 streetcar neighborhoods on the near south side to subdivisions still under construction on the far north and far west edges. Arlington is a large market in its own right with its own distinct development eras. The northeast mid-cities of Hurst, Euless, Bedford, North Richland Hills, Richland Hills and Watauga are largely a 1960s through 1990s suburban buildout. Grapevine, Southlake, Colleyville and Keller are a different story again, with substantial newer custom and semi-custom housing.
Then there is the rest of it: Mansfield, Kennedale, Crowley, Burleson, Benbrook, White Settlement, Saginaw, Haltom City, Forest Hill, Everman, River Oaks, Sansom Park, Lake Worth, Azle, Haslet, Blue Mound, Pelican Bay, Lakeside, Westworth Village, and the small towns of Pantego, Dalworthington Gardens, Edgecliff Village and Westover Hills, each with its own government and its own rules.
The practical point is that a Tarrant County address tells me almost nothing on its own. Before I look at a single sale I establish what era the subject was built in, what the original build standard was, and which of these markets it actually competes in.
A Fort Worth mailing address is not a Fort Worth property
This trips up more reports than any other single issue in this county. Postal addresses do not follow city limits or county lines. A property with a Fort Worth mailing address may sit in unincorporated Tarrant County, in Fort Worth's extraterritorial jurisdiction, or inside a different municipality entirely. That changes which government issues permits, which ordinances apply, and which taxing units appear on the bill.
County lines matter the same way. Several Tarrant County cities extend into neighboring counties: parts of Mansfield reach into Johnson and Ellis, parts of Burleson sit in Johnson County, Grand Prairie extends into Dallas and Ellis, and Trophy Club and Roanoke straddle the Denton County line. Property is appraised by the appraisal district for the county where the land physically sits, not by the district matching the city name. A Burleson homeowner may be dealing with the Central Appraisal District of Johnson County rather than Tarrant Appraisal District.
Tarrant Appraisal District and the protest calendar
Tarrant Appraisal District appraises all property in the county for ad valorem taxation. It is a mass appraisal operation: values are produced by model across large groups of properties, not by individual inspection of each home. That is not a criticism, it is how the statute requires the work to be done at that scale, but it explains why TAD records so often disagree with a measured, inspected appraisal on square footage, condition, effective age and features.
Under Texas law the general deadline to file a protest is May 15, or 30 days after the appraisal district's notice of appraised value is delivered, whichever is later. Property owners can request an informal meeting with the district before the formal Appraisal Review Board hearing. The ARB must give written notice of the hearing date at least 15 days in advance, and owners may appear in person, by telephone or videoconference, or by written affidavit.
If you want an appraisal to use as evidence, it needs a January 1 effective date for the tax year in question. Order it early. Everyone in the county has the same deadline, and the last three weeks before May 15 are the most congested of the year for residential appraisers here.
Measurement disputes are the norm here, not the exception
Since April 2022, appraisals delivered to Fannie Mae have had to follow the ANSI Z765 measuring standard. It sets a seven foot minimum finished ceiling height, a specific rule for sloped ceilings where at least half the finished area of the room must reach seven feet and nothing under five feet counts, and a rule that treats an entire floor level as below grade if any portion of its walls is not fully at or above ground level.
In a county with this much older housing, that produces a lot of differences from county records. Attic conversions in pre-1940 bungalows, enclosed porches, converted garages and carports, sunrooms built over patio slabs, and hillside lower levels in the west side neighborhoods all get treated differently under ANSI than they may be carried by the district.
Fort Worth historic overlays and where they apply
Fort Worth's historic preservation ordinance uses three overlay designations. Historic and Cultural (HC) applies to properties or districts meeting two or more significance criteria and requires a Certificate of Appropriateness for exterior construction, alteration, repair, relocation or demolition. Highly Significant Endangered (HSE) applies to properties meeting three or more criteria that face loss through neglect, disrepair or demolition pressure, with the same COA requirements. Demolition Delay (DD) is the lightest, applying to properties meeting a single criterion, requiring review only for demolition or relocation, and the commission cannot deny the COA outright but can delay demolition for up to 180 days.
Fort Worth has a set of local historic districts carrying HC designation, including Elizabeth Boulevard, Fairmount-Southside, Mistletoe Heights, Kenwood Court, Central Handley, Terrell Heights, Hillcrest Tremont, Historic Morningside, Historic Carver Heights, Garden of Eden and Stop Six Sunrise Edition. Conservation districts exist in the code but are not widely used.
These overlays only apply within Fort Worth. Arlington, Grapevine, Mansfield and other Tarrant cities run their own preservation programs on their own terms, and separately incorporated towns like Westover Hills regulate under their own ordinances. I check the specific jurisdiction for the specific parcel rather than generalizing.
What I take and what I do not
My scope throughout Tarrant County is one-to-four unit residential property and residential land. That includes single-family houses, duplexes, triplexes and fourplexes, townhomes and residential condominium units, and vacant residential lots. It does not include commercial property, apartment properties of five units or more, or subdivision development analysis, and I do not accept those assignments anywhere.
My fee is quoted before I start. It does not vary with the value I report, with whether a transaction closes, or with the outcome of a protest. Terrence Bilodeau, Texas Certified Residential Appraiser #1360232-CR, (817) 903-4509. Turnaround is generally 5 to 7 business days from inspection, and fees start at $500 for a standard single-family home.
Property tax protest
“I have been in real estate investing over 30 years. Clearfork Appraisals is a true professional I regularly rely on. The body of work he provides is unmatched.”Gregory Baillio · Google review
Common questions
My address says Fort Worth. Am I in the city limits?
Not necessarily. Postal addresses do not follow city limits, ETJ boundaries or county lines. I verify jurisdiction from the parcel record, because it determines which government issues permits and which ordinances and taxing units apply.
When do I have to file a protest with Tarrant Appraisal District?
The general deadline is May 15, or 30 days after the district delivers your notice of appraised value, whichever is later. If you want an appraisal as evidence, it needs a January 1 effective date and should be ordered well before the deadline.
Why does TAD's square footage differ from an appraisal?
TAD performs mass appraisal, producing values by model across large groups of properties rather than by individual interior inspection. An appraisal involves a measured, inspected property under the ANSI standard. Older housing, attic conversions, enclosed porches and hillside lower levels are where the two most often diverge.
Do you appraise duplexes and fourplexes?
Yes. One-to-four unit residential is within my scope, and for two-to-four unit property I consider rent evidence alongside sales. I do not appraise apartment properties of five units or more, or commercial property.
Can you appraise a property in Burleson or Mansfield?
Yes, but note that parts of both cities sit outside Tarrant County. Property is appraised by the district for the county where the land physically sits, so a Burleson property may fall under the Central Appraisal District of Johnson County. I confirm that at the parcel level.
What percentage of houses sell in Tarrant County?
Across the three years to October 2026, 31.3% of resolved Tarrant County listings ended without a sale — 29,956 of 95,596. Those listings sat on 76,374 distinct addresses, 18.8% of which were listed more than once, and 16.9% of those addresses never sold at all. That is the most reliable market measured in this research; every surrounding county is worse, with Johnson at 18.4%, Parker 22.2%, Hood 23.6%, Wise 26.4% and Erath 27.0%. Of the Tarrant listings that failed, 42% were at an address that sold under a different listing.
Is overpricing why houses do not sell in Fort Worth?
Less than people assume. In Tarrant County the houses that sold opened at a median 4% above the price per square foot the market was actually paying, and the houses that never sold opened at 6% — a two-point gap, the narrowest of six counties measured. By comparison the gap is 7 points in Parker and Wise and 17 points in Erath. In a market with roughly 21,000 closings a year a mispriced house tends to get corrected quickly, so Tarrant failures are more often explained by the age of the building, the top of the market or the amount of land than by the opening price.
Which Tarrant County cities are hardest to sell in?
Measured by the share of addresses that never sold over three years, Azle at 19.6%, Haltom City at 19.0% and Fort Worth itself at 18.7% are the weakest, against Bedford at 10.7%, Grapevine at 11.3% and Colleyville at 11.6%. Fort Worth accounts for 36,040 addresses, nearly half the county, and contains both the pre-1950 housing stock that fails 24.9% of the time and the newer growth on the city's edges, which is why the city-wide figure sits below the mid-cities.
Why do older Fort Worth houses fail to sell more often?
Pre-1950 Tarrant County houses never sold 24.9% of the time over three years, against 15.1% for 1990s and 2000s stock. Condition varies far more in that stock than an appraisal grid captures, two houses on the same block can differ substantially in value, and financing options narrow when a lender's appraiser reports a condition issue. Houses built between 2010 and 2022 are the second weakest group at 21.1%, competing directly against new construction that carries builder incentives they cannot match.
- Source: North Texas Real Estate Information Systems (NTREIS) residential listing records for Tarrant County, 17 October 2023 to 15 October 2026. 104,532 listings on 76,374 addresses, of which 95,596 resolved — 65,640 sold and 29,956 expired, cancelled or withdrawn. Listings still active at the end of the period are excluded from failure rates. The county was exported in twenty-eight price bands across two date windows to stay within MLS export limits; the bands are combined and de-duplicated here.
- Two failure measures are reported. The listing rate is the share of resolved listings that came off the market without selling. The property rate groups listings by street address and counts an address as sold if any of its listings closed; 18.8% of addresses carried more than one listing. Sold listings are counted on close date and unsold listings on status-change date, so both sides of every rate cover the same span.
- Opening ask comparisons use original list price per square foot against closed price per square foot, both medians, excluding records without a usable living area.
- Lot sizes are derived from the MLS square-footage field rather than the acreage field; 7.6% of Tarrant County listings carry an acreage field that disagrees with it.
- Cities are reported where at least 200 addresses resolved. Figures are aggregate; no individual listing, address, price or client is identified.
Market statistics describe past transactions in aggregate and are not an opinion of value for any particular property. Nothing here is an appraisal. Data supplied by NTREIS and believed reliable but not guaranteed; NTREIS does not warrant it and it may not reflect all market activity. Figures as at the date of publication.