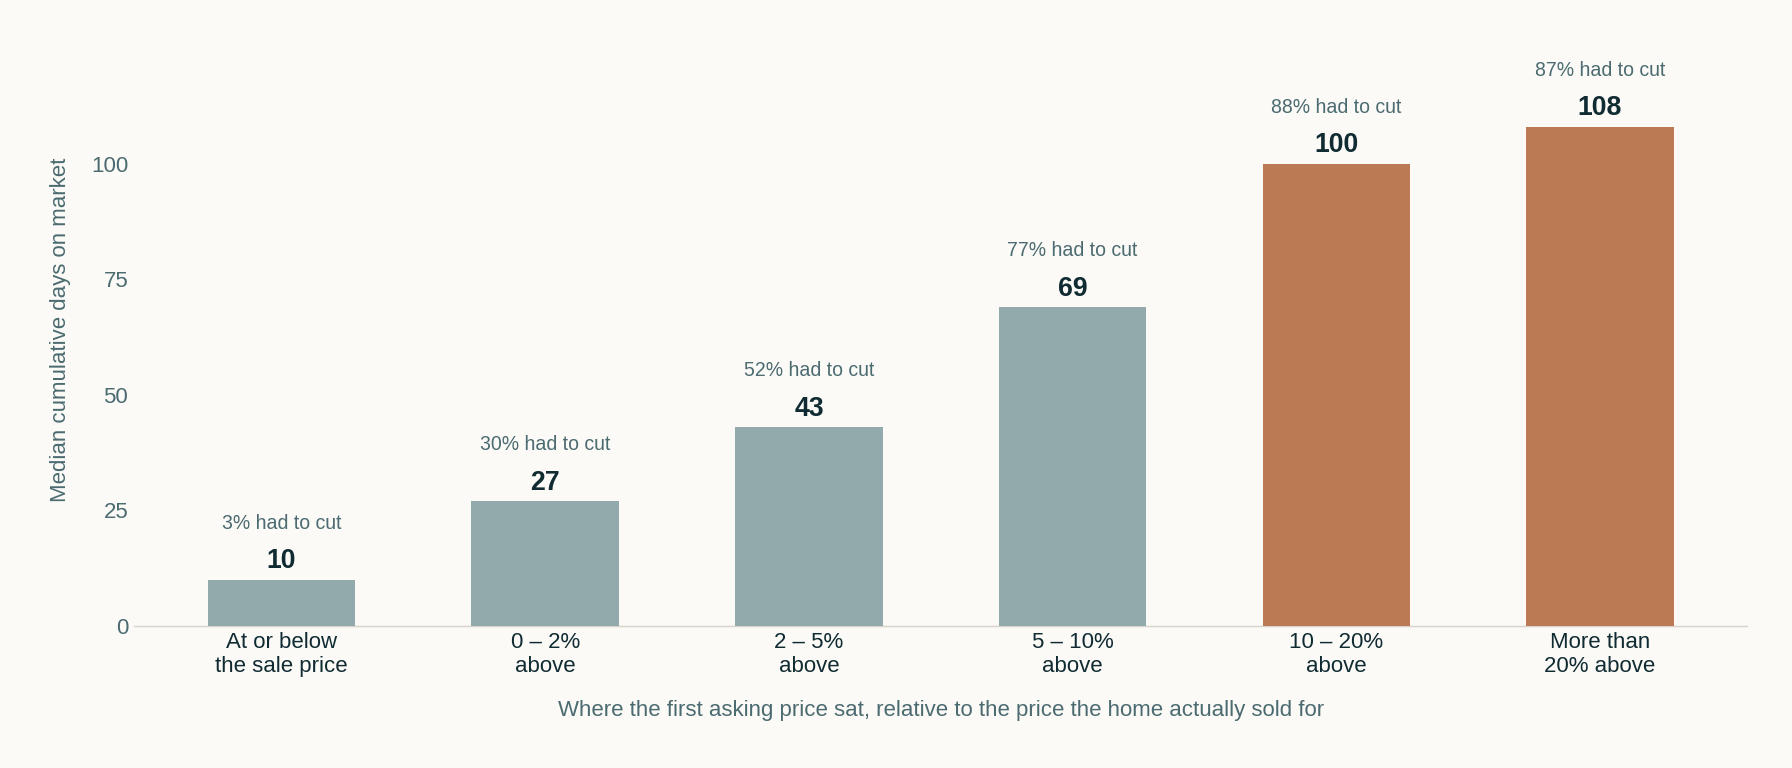
- Ten days against a hundred. Homes whose first asking price sat at or below what they eventually sold for went under contract in a median of 10 days. Homes that started 10–20% above took 100.
- They got the same price anyway. 88% of the sellers who started 10–20% high cut their price, and came down a median of $16,000 to finish.
- Then it costs the sale. Listings priced within 3% of what the data supported failed to sell 14.7% of the time. Listings more than 25% above failed 34.1% of the time.
- Each 10% of additional asking price adds about 15% to time on market and multiplies the odds of selling at all by 0.83.
- It gets worse as the price rises. Between $400,000 and $750,000, correctly priced homes took 13 days and overpriced ones took 130.
- 37.5% of sellers started more than 5% above the price their home eventually sold for.
Every seller has heard that you should not overprice a house, and almost every seller believes it applies to other people. The reasoning is intuitive and wrong: you can always come down, so you may as well start high and see what happens.
Here is what happens, measured across 114,946 resolved listings in Dallas–Fort Worth.
The Cleanest Way to Measure This
The difficulty with a question like this is that expensive-looking homes list high because they are worth more, and no model sees everything about a house. Condition, finish quality, the renovation nobody photographed, where the lot sits on the street — none of it is in a searchable field.
So the first measurement here uses no model at all.
For every home that sold, compare its first asking price to the price that same home actually sold for. Same house, same kitchen, same lot. Whatever the data cannot see is held constant automatically, because it is the identical property on both sides of the comparison.
The median seller started 3.1% above the price their home eventually sold for. The mean was 5.3%, pulled up by a long tail.
Ten Days Against a Hundred
| First asking price | Share of sellers | Median days on market | Had to cut |
|---|---|---|---|
| At or below the eventual sale price | 28.3% | 10 | 3% |
| 0 – 2% above | 13.1% | 27 | 30% |
| 2 – 5% above | 20.4% | 43 | 52% |
| 5 – 10% above | 19.5% | 69 | 77% |
| 10 – 20% above | 13.7% | 100 | 88% |
| More than 20% above | 4.9% | 108 | 87% |
Read the first and fifth rows together. A seller who opened at the market’s number was under contract in a week and a half and never touched the price. A seller who opened 10–20% above spent more than three months on the market, cut the price with 88% probability, and sold the same house.
The cut itself is not small. Sellers who started 10–20% high came down a median of $16,000 between the first asking price and the closing. Above 25%, the median retreat was $35,000.
Every home in that table sold. This is not a comparison of winners and losers — it is the same outcome reached two different ways. One took ten days. The other took a hundred, with a price reduction in the middle and the same cheque at the end.
And Then It Costs You the Sale
Days on market only describes the sellers who finished. To see the rest, every resolved listing — sold, cancelled, expired and withdrawn — was scored against what comparable sales in its own subdivision supported at the time it was listed.
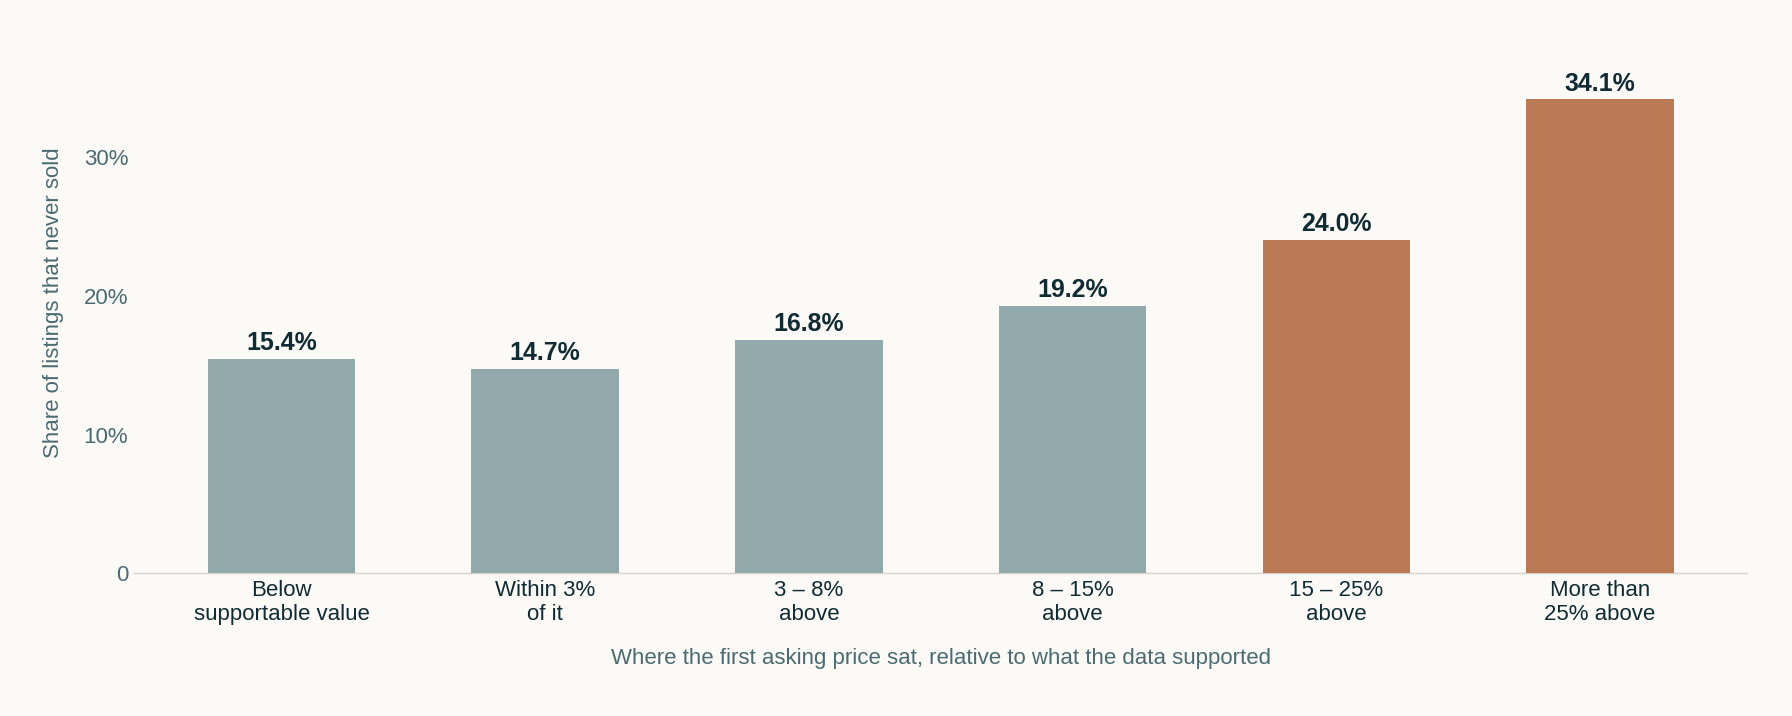
Listings priced within 3% of supportable value failed 14.7% of the time. At 8–15% above, 19.2%. Above 25%, 34.1% — one in three never sells.
Holding living area, lot size, year built and the quarter the listing began, each additional 10% of asking price raises cumulative days on market by about 15% (interval 13.0% to 16.9%) and multiplies the odds of selling at all by 0.83 (interval 0.805 to 0.862).
It Gets Worse as the Price Goes Up
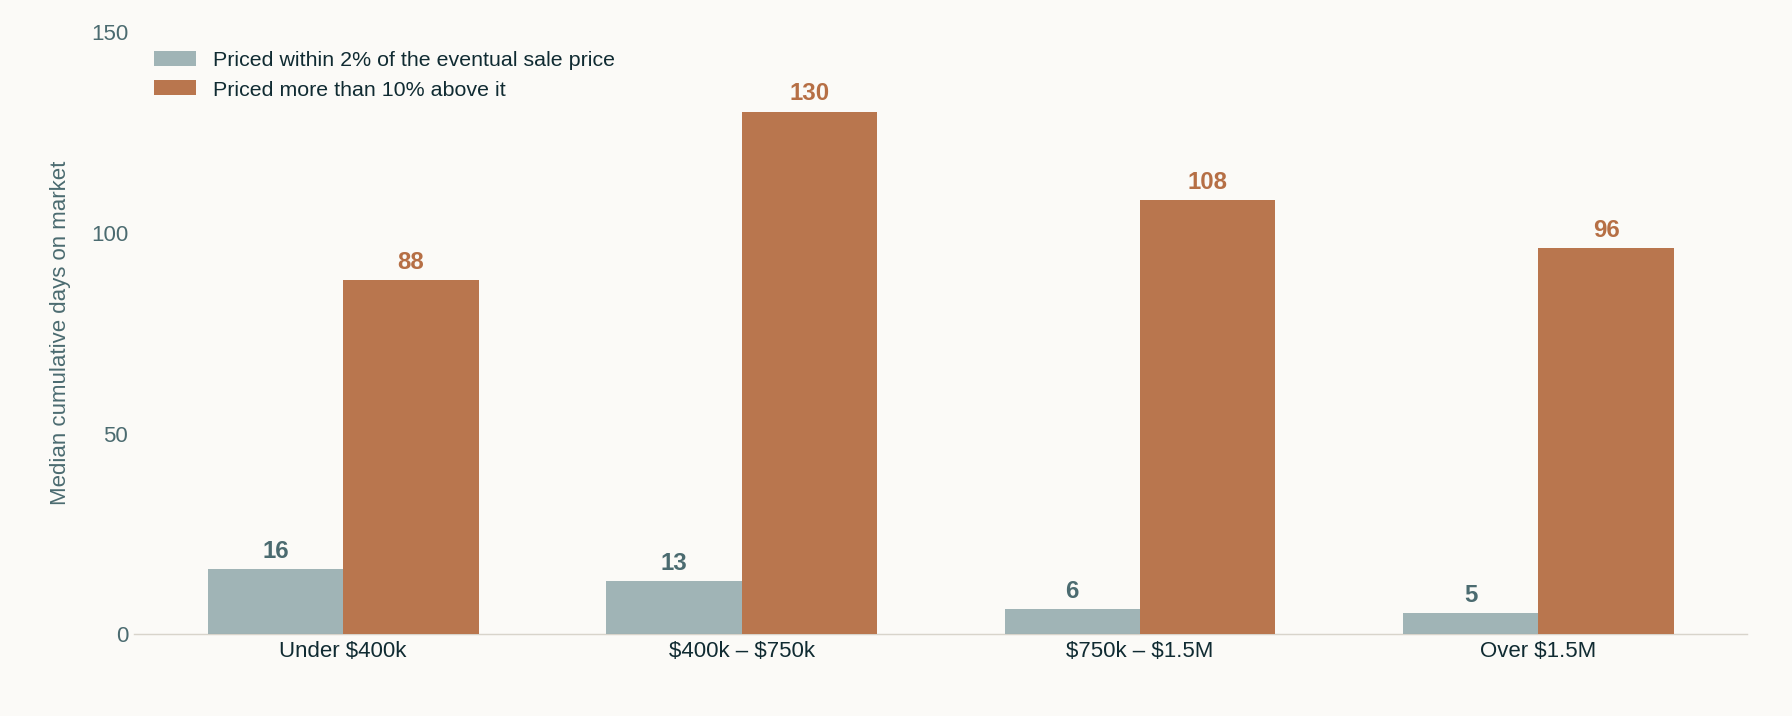
Above $750,000 a correctly priced home went under contract in five or six days. The same tier priced more than 10% high took around a hundred. The buyer pool is smaller and better informed at the top, and it does not negotiate with an asking price it considers unserious — it simply does not call.
The failure rates follow. Over $1.5 million, listings priced within 3% of supportable value failed 22.7% of the time; those more than 15% above failed 40.9% of the time.
The Number I Cannot Give You
The obvious question is what overpricing does to the final sale price, and the honest answer is that this data cannot tell you.
Run the regression and it reports that each 10% of extra asking price is associated with an 8.6% higher sale price, which looks like proof that aiming high works. It is not. Homes that asked 25% above the model’s estimate went on to sell about 29% above it — the ask passes through to the sale price almost one for one.
That pattern is the signature of a model that cannot see the house, not of seller pricing power. A home listed well above its statistical twin is usually genuinely better than the statistics know, and it sells for more because it is worth more. The listing agent could see the renovation. The regression could not.
If asking more reliably produced more, no seller would ever reduce a price, and 88% of one group here did.
That same blind spot runs against the results above. If homes asking far above the model are genuinely nicer properties, they ought to sell more easily — and instead they fail more than twice as often. The bias works in the opposite direction from the finding, which makes the finding more credible rather than less.
Why Sellers Do It Anyway
Three reasons, and none of them is stupidity.
The option looks free. You can always reduce, so starting high appears to cost nothing. It costs the first three weeks, which are the weeks when a listing has every buyer’s attention and an automatic alert in their inbox. Spend them at the wrong number and you re-enter the market later as an older listing.
Somebody told them a higher number. When three agents give three opinions, the highest one is not usually the best analysis — it is sometimes just the one most eager for the listing. The market does not honour the estimate it was given.
The number is attached to something else. What is owed, what the next house costs, what a neighbour reportedly got. None of it is evidence of value, and a buyer is not party to any of it.
What This Means for Pricing a Listing
The first three weeks are the asset. Showing activity and saved-search traffic peak immediately and decay. Pricing is the decision about whether that attention meets a credible number.
A reduction is not a reset. Cumulative days on market follows a property across listings. Buyers and their agents read it, and a long history invites a lower offer rather than a faster one.
Test-the-market pricing has a measurable price. It is roughly ninety additional days, an 88% chance of cutting anyway, and a materially higher chance of not selling — in exchange for a sale price the market was always going to decide.
Above $750,000, the penalty is larger, not smaller. Thin buyer pools do not bargain. They skip.
Where an Appraisal Fits
A pre-listing appraisal is an independent opinion of what the market supports, produced before the number becomes an argument between a seller and an agent who wants the listing.
It does not guarantee a sale price and nothing here should be read as predicting one. What it does is establish the supportable number from comparable sales, with the adjustments shown, so the pricing decision is made against evidence rather than against hope.
Agents use these for the same reason, most often on homes that are difficult to price because the comparable sales are thin — unusual properties, acreage, custom construction, or neighbourhoods where few similar homes have traded recently. Those are precisely the listings where the first asking price is most likely to be wrong by a wide margin.
And if the conclusion comes in below what everyone hoped, that is the finding arriving three months early rather than three months late.
Common questions
How much does overpricing a house cost in time?
About ninety additional days at the median. Across 88,680 Dallas-Fort Worth closed sales, homes whose first asking price sat at or below the price they eventually sold for went under contract in a median of 10 cumulative days on market. Homes that opened 10 to 20 percent above took 100 days, and homes more than 20 percent above took 108.
Do overpriced homes eventually sell for more?
There is no evidence they do. Of the sellers who opened 10 to 20 percent above their eventual sale price, 88 percent reduced the price before closing, coming down a median of $16,000. Above 25 percent the median retreat was $35,000. The final price is set by the market rather than by the opening ask.
What percentage of overpriced listings never sell?
Measured against what comparable sales in the same subdivision supported, listings priced within 3 percent of supportable value failed to sell 14.7 percent of the time. At 8 to 15 percent above it was 19.2 percent, at 15 to 25 percent above 24.0 percent, and more than 25 percent above 34.1 percent - roughly one in three.
Is it worse to overprice an expensive house?
Yes. Homes above $750,000 priced within 2 percent of their eventual sale price went under contract in five to six days. The same tier priced more than 10 percent above took around a hundred days. Above $1.5 million, listings more than 15 percent above supportable value failed to sell 40.9 percent of the time against 22.7 percent for those priced close to it.
How many sellers overprice?
More than a third. Across the closed sales measured, 37.5 percent of sellers set a first asking price more than 5 percent above the price their home eventually sold for, and 4.9 percent set one more than 20 percent above. About 28 percent opened at or below their eventual sale price.
Does reducing the price fix an overpriced listing?
It resolves the price but not the history. Cumulative days on market follows a property across successive listings and is visible to buyers and their agents, so a long marketing history tends to invite lower offers rather than faster ones. In this data, each additional 10 percent of asking price raised cumulative days on market by about 15 percent and multiplied the odds of selling at all by 0.83.
Can a pre-listing appraisal prevent overpricing?
It establishes what comparable sales support before the asking price is set, with the adjustments shown. It is an independent opinion of market value rather than a prediction of a sale price, and no appraisal can guarantee an outcome. Its practical use is on homes that are hard to price because comparable sales are limited, which is where first asking prices are most often wrong by a wide margin.
- North Texas Real Estate Information Systems (NTREIS). Detached single-family listings with a listing contract date from January 2023 onward across Tarrant, Parker, Johnson, Ellis, Denton, Hood and Wise counties: 114,946 resolved listings (88,856 closed, 26,090 cancelled, expired or withdrawn). The within-property comparison uses 88,680 closed sales; the supportable-value comparison scores 83,009 listings in 2,456 subdivisions with at least eight closed sales each. Author’s analysis; figures reported in aggregate.
The first comparison is model-free: each closed listing’s original list price is compared to the price that same property subsequently sold for, so unobserved characteristics are held constant by construction. The second scores every resolved listing against an expected value from a log-price regression on living area, lot size, year built, subdivision and listing quarter, fitted on closed sales (within-subdivision R² 0.528). Days-on-market effects come from OLS on log cumulative days on market and sale-or-fail effects from logistic regression, both holding living area, lot size, year built and listing quarter constant with standard errors clustered by subdivision. A regression of sale price on asking price is deliberately not reported: list price carries information about condition and finish that the MLS does not record, so that coefficient measures the model’s blind spot rather than any effect of pricing. Cumulative days on market is as reported to NTREIS and is not independently verified. This article is a general market study. It is not an appraisal, it is not a prediction of any sale price, and it is not a valuation opinion about any specific property.