- The most common thing sellers do after a failed listing is the thing that works least. 16,487 houses came back within two weeks — more than a third of all relists — and 48.3% of them sold. The worst result of any group.
- More than half of them came back at the same price. Median price change: 0.0%.
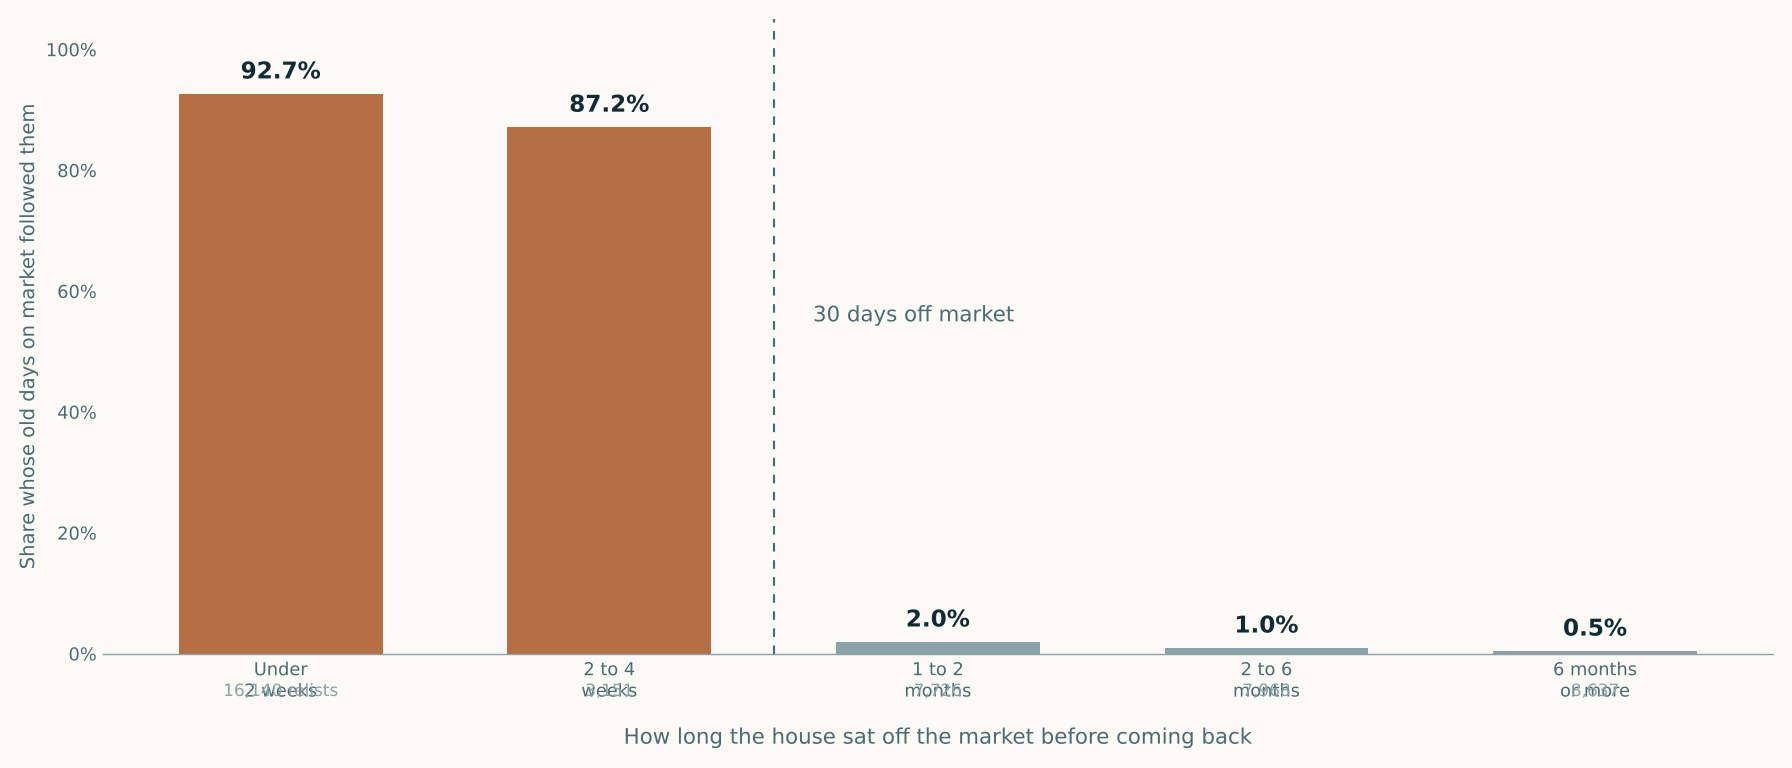
- And they did not even get the clock reset. 92.7% carried their old days on market straight back onto the new listing.
- Wait past 30 days and the days-on-market counter resets. Under two weeks, 92.7% carry. Past a month, 2.0% do. It is a cliff, not a slope.
- The sellers who waited a month or two did best: 59.3% sold. Eleven points better than the two-week crowd, and 69% of them actually changed the price.
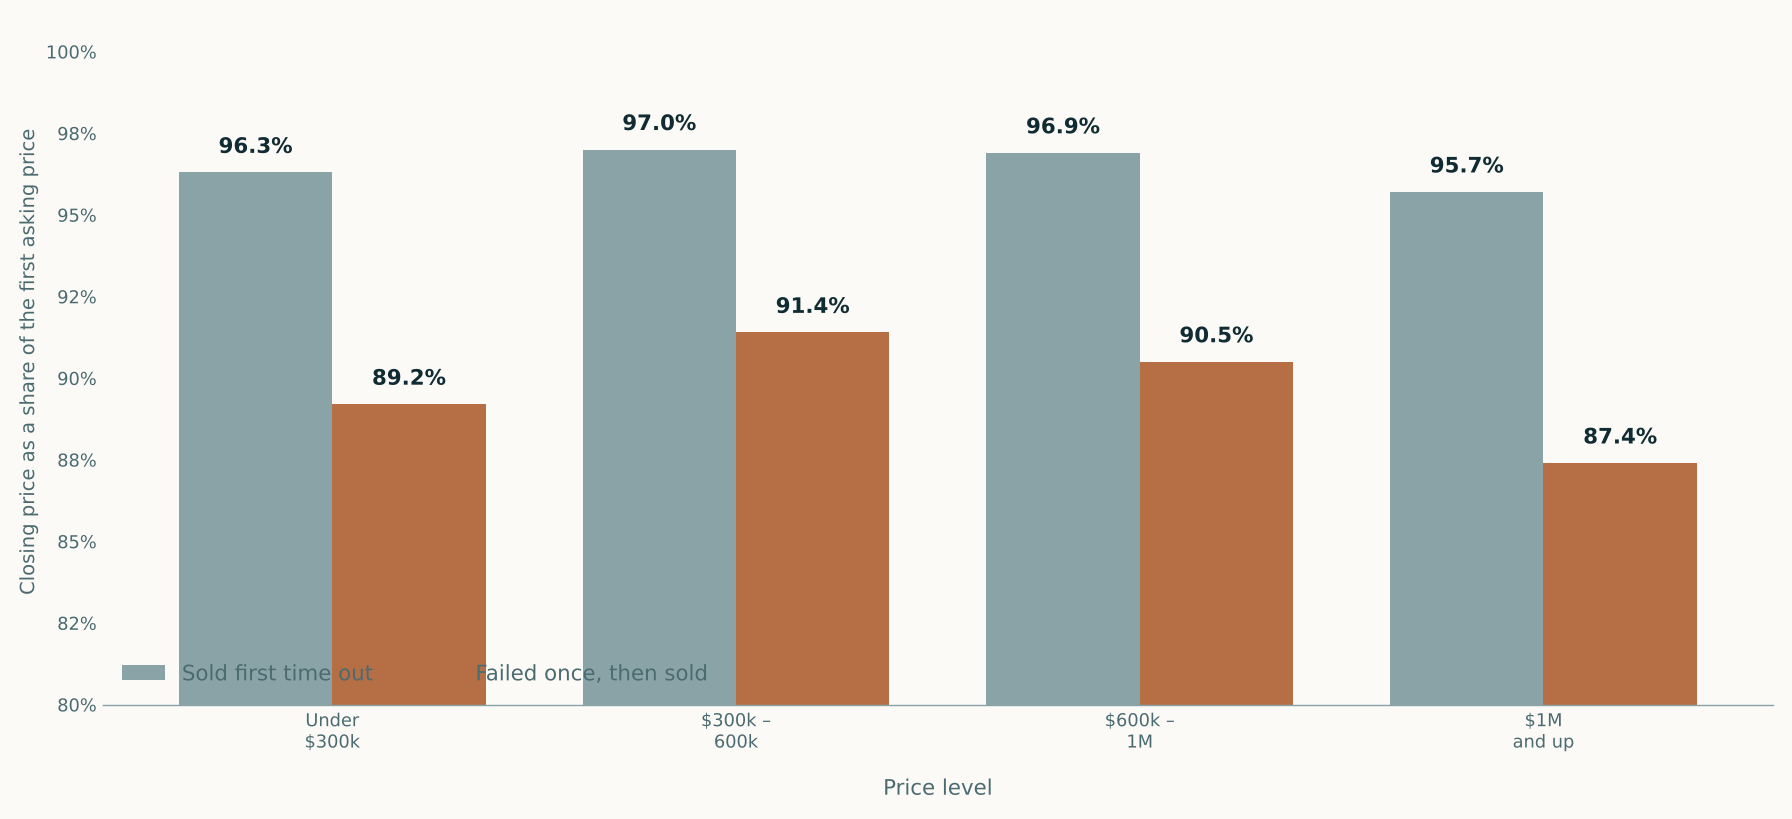
- A failed first attempt costs 6 to 8 points of the original asking price — and the penalty is worst above $1 million, where relisting is also most common.
About one house in five that sells in North Texas sold on its second or third attempt. That is 20,239 closings out of 143,177 — 14.1% of everything that sold had failed at least once first, rising to 20.0% above a million dollars.
So what a seller does after a listing expires is not an edge case. It is a decision facing a substantial minority of everyone who sells, usually taken quickly, often on an agent’s advice, and almost never with any evidence attached.
Here is the evidence. 44,467 relisted houses across eight North Texas counties, measured by how long they sat off the market before coming back.
First, the rule everybody is playing against
Cumulative days on market is the number a buyer’s agent reads out loud. A house showing 180 days invites an offer that a house showing 6 days does not, whatever the two properties are actually worth.
So the counter matters, and there is a threshold: come back within about 30 days and your accumulated days follow you. Stay off longer and the new listing starts at zero.
The data shows that threshold with unusual clarity. Of houses relisted within two weeks, 92.7% carried their old days on market. At two to four weeks, 87.2%. Past a month it collapses to 2.0%, then 1.0%, then 0.5%.
There is no gentle transition. It is a rule, and it is being enforced.
The two-week relist gets nothing, and it is the most popular choice
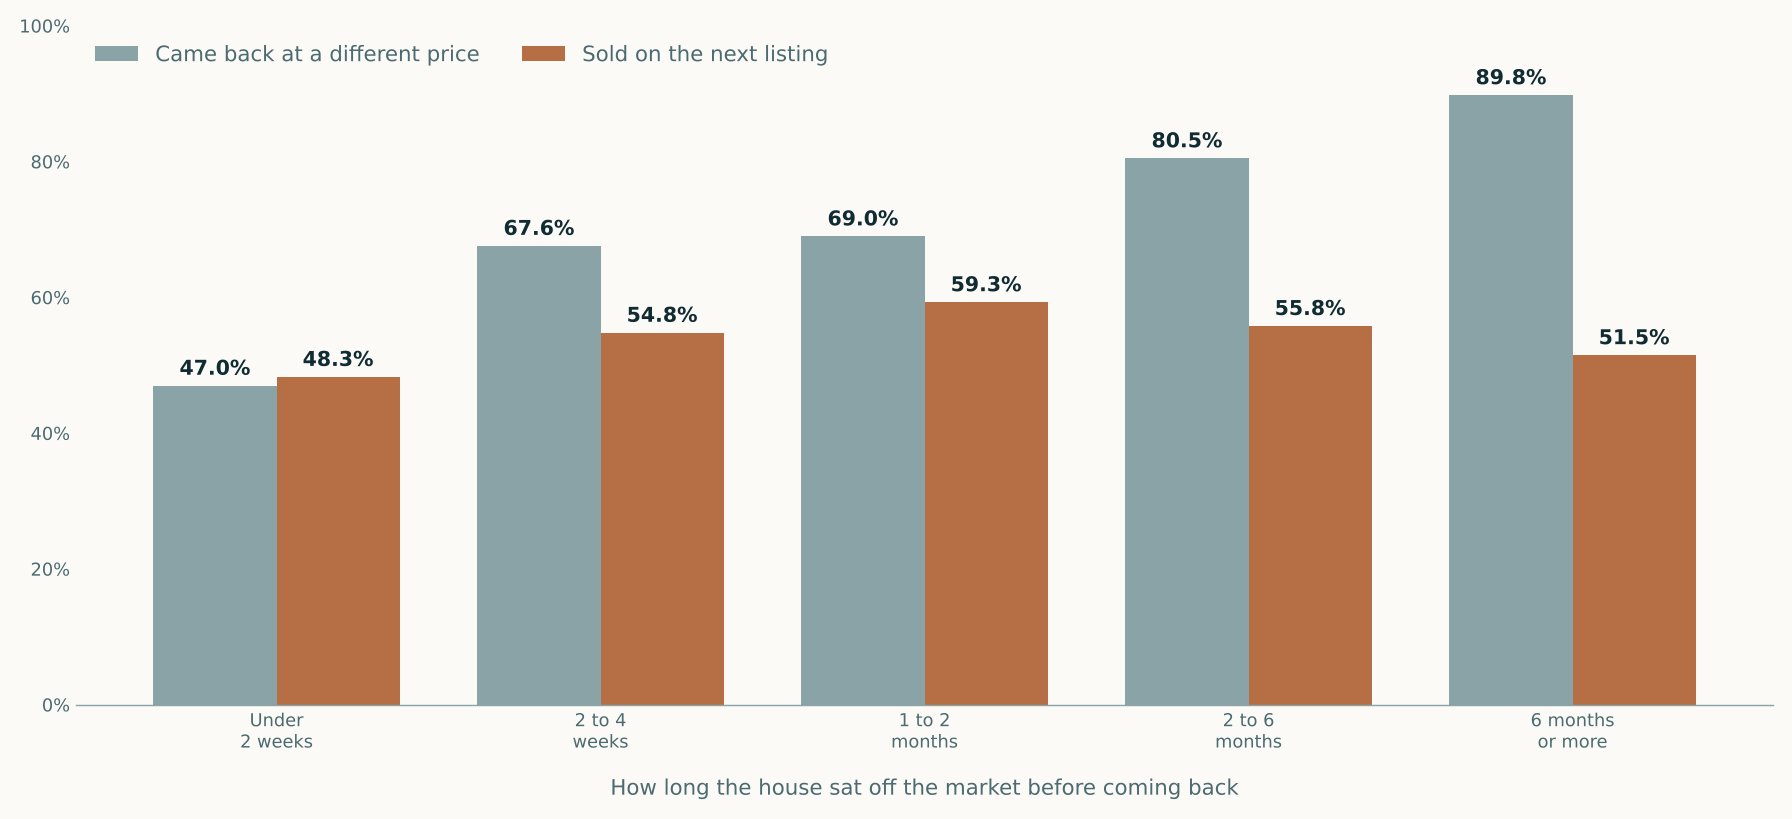
16,487 houses came back inside two weeks. That is more than a third of every relist in the dataset and by far the single most common choice. Here is what those sellers got:
- No reset. 92.7% carried their old days on market anyway.
- No new price. Only 47.0% came back at a different number, and the median change across all of them was 0.0%.
- No new representation. 28.8% changed brokerage, the lowest of any group.
- And 48.3% sold — the worst outcome of any waiting period.
The sign came down, ten days passed, the sign went back up with the same number on it, and the days-on-market counter kept running the whole time. Nothing about the house, the price or the marketing had changed. The market was being asked the same question again and it gave the same answer.
Compare that with the group who waited one to two months: the clock reset, 69.0% came back at a different price, and 59.3% sold. Eleven points better, on 7,840 relists.
It is tempting to read this as “wait 30 days to clear your days on market.” That is probably not the mechanism. Look at what else changes as the gap lengthens: repricing goes from 47.0% to 69.0% to 80.5%, and the share changing brokerage climbs from 28.8% to 55.8%. The long gap is a marker for having actually reassessed — a different price, often a different agent, sometimes work done to the house. The seller told to take it off for a fortnight and quietly relist is being given a clock trick instead of a diagnosis, and the clock trick does not even work.
Note also that it does not improve forever. Past six months the success rate falls back to 51.5%, despite 89.8% of those sellers repricing and 78.1% changing brokerage. Those sellers also raised their price by a median 1.2% — a different population, waiting out a market or finishing work, not correcting a mistake.
The best outcome sits at one to two months. Long enough to reset and reassess, short enough that the reassessment is still about this sale.
What a failed first attempt costs
| Price level | Share of closings that were relists | Sold first time out | Failed once, then sold | Cost |
|---|---|---|---|---|
| Under $300,000 | 13.5% | 96.3% | 89.2% | 7.0 pts |
| $300,000–600,000 | 13.4% | 97.0% | 91.4% | 5.6 pts |
| $600,000–1,000,000 | 16.2% | 96.9% | 90.5% | 6.4 pts |
| $1 million and up | 20.0% | 95.7% | 87.4% | 8.3 pts |
A house that sells first time out closes at about 96% of what it first asked. A house that fails and comes back closes at 87–91%. The failed attempt costs six to eight points of the original ask, and the cost is highest above a million dollars — which is also where one closing in five is a relist.
That is the real price of the two-week relist. Not the fortnight. The six to eight points.
A chart that looks like advice and is not
One finding in this data is tempting and should be resisted, and it is worth showing rather than hiding.
Among relisted houses above $1 million, grouped by what the seller did to the asking price when they came back:
| What the seller did | Sellers | Closed at, as a share of first ask |
|---|---|---|
| Cut the asking price | 646 | 84.3% |
| Held the same number | 491 | 89.4% |
| Raised it | 221 | 93.7% |
| Sold first time out, for comparison | 5,416 | 95.7% |
Read quickly, that says raise your price. It says nothing of the sort.
Sellers do not choose these groups at random. A seller raises the asking price on a relist because something improved — the market moved, work was finished, the first listing was genuinely underpriced. A seller cuts because showings were not happening and the feedback was consistent. The price change is a symptom of the position the seller was already in, not a treatment applied to it.
So the table measures which sellers were in trouble. It does not measure what to do about it. And note that even the best relist group at 93.7% still lands below the 95.7% achieved by houses that sold first time out — every one of these sellers would rather have been in the other column.
This is the same trap that runs through every statistic on this page and through the wider research: the data you can see has already been filtered by decisions people made for reasons the data does not record. It is worth stating plainly, because the charts above are useful precisely to the extent that you know what they cannot tell you.
If your listing just expired
Taking it off for a week or two and putting it straight back is the most common response and the weakest one. You keep the days on market, you usually keep the price, and 48.3% sell. If nothing is going to change, the break achieves nothing.
If you are going to pause, pause past 30 days. That clears the counter, and more importantly it is long enough to do the thing that actually correlates with selling: look again at the price.
Assume the first ask was the problem until something rules it out. Across six counties, the houses that sold opened at about 5% above what the market was actually paying and the houses that failed opened higher — by 7 points in Granbury and 17 in Erath. If the first number was set from a desired outcome rather than from evidence, nothing about a fortnight off the market changes that.
And know what the second attempt is likely to cost. Six to eight points of your original ask, eight above a million. That is the figure to weigh against whatever the first price was supposed to achieve.
If the question is “what will this house actually support,” that is an appraisal question and a pre-listing appraisal answers it — an independent opinion developed from the evidence, before the price becomes an argument between a seller and an agent. If the question is “how should this be marketed and who should represent me,” that is not an appraisal question and I will not pretend otherwise. I hold a Texas broker licence and work as an agent through The Bilodeau Group at Compass; those are separate engagements with separate obligations, and an appraisal is not a listing presentation.
Common questions
Does taking your house off the market reset days on market?
Only if you stay off long enough. Measured across 44,467 relisted North Texas houses, 92.7% of those that came back within two weeks carried their old cumulative days on market onto the new listing, as did 87.2% of those back within two to four weeks. Past about 30 days it collapses: 2.0% at one to two months, 1.0% at two to six months and 0.5% beyond that. The threshold is roughly 30 days off market and the transition is abrupt rather than gradual.
How long should you wait before relisting a house?
The best outcomes in this data came from waiting one to two months, where 59.3% sold on the next listing. Relisting within two weeks produced the worst result at 48.3%, and waiting more than six months fell back to 51.5%. The waiting period itself is probably not the mechanism: the share of sellers who came back at a different price rose from 47.0% under two weeks to 69.0% at one to two months and 80.5% at two to six months. The longer pause is a marker for having actually reassessed the price rather than simply restarting the clock.
Does relisting a house hurt the price?
Measured from the first asking price, yes. Houses that sold on their first listing closed at a median 95.7% to 97.0% of what they first asked, depending on price level. Houses that failed once and then sold closed at 87.4% to 91.4%. The gap is 5.6 to 8.3 percentage points and is widest above $1 million, where 20.0% of all closings were relists.
What percentage of houses sell on the second try?
Across eight North Texas counties, 14.1% of closings were houses that had failed at least one earlier listing — 20,239 of 143,177. The share rises with price: 13.5% under $300,000, 13.4% from $300,000 to $600,000, 16.2% from $600,000 to $1 million, and 20.0% above $1 million.
Should you change agents when you relist?
This data cannot answer that, and it is worth being clear about why. The share of sellers changing brokerage rises with the length of the pause — 28.8% under two weeks, 55.8% at two to six months, 78.1% beyond six months — and the longer pauses also show higher sale rates. But those sellers also repriced far more often, so changing representation and changing the price move together and cannot be separated here. What the data does show is that the group who changed least of all, the two-week relists, sold least often.
- North Texas Real Estate Information Systems (NTREIS) residential listing records for Tarrant, Denton, Ellis, Johnson, Parker, Hood, Wise and Erath counties, 17 October 2023 to 15 October 2026. 244,381 unique listings after de-duplication.
- Listings are grouped into properties by street number, name, suffix, unit and city. An address carrying more than one resolved listing is treated as relisted; 44,467 consecutive listing pairs were measured, of which the 43,622 recording both day counters are used for the days-on-market comparison. Addresses entered inconsistently across listings would be missed, which understates relisting rather than overstating it.
- Time off market is measured from the earlier listing’s status-change date to the later listing’s contract date. “Carried old days on market” means the new listing’s cumulative days on market exceeded its own days on market by more than one day.
- “Came back at a different price” compares the later listing’s original list price with the earlier listing’s final list price, counting changes above 0.5% in either direction.
- Price-level comparisons use the closing price against the first listing’s original asking price, so both groups are measured from what the seller originally wanted.
- Figures are aggregate. No individual listing, address, price, client or agent is identified, and confidential listing remarks were excluded from the dataset entirely.
These are observational figures. Sellers choose how long to wait and whether to reprice, and those choices are not random, so the differences reported here describe what happened rather than what any particular course of action would cause. Market statistics describe past transactions in aggregate and are not an opinion of value for any particular property. Nothing here is an appraisal. Data supplied by NTREIS and believed reliable but not guaranteed; NTREIS does not warrant it and it may not reflect all market activity.