Finally answering it
In the article on contributory value I opened with “how much does a pool add?” and spent two thousand words explaining why no portable answer exists. That is still true. The number moves with price tier, with neighbourhood, with the buyer pool and with the year.
But “it depends” is only useful if somebody has done the measuring. So here it is measured, with the conditions attached.
12,741 pools in 89,302 detached single-family closings across Dallas–Fort Worth, 2023 through September 2026. The method is the one I used on elevators: compare each house against others in its own subdivision, holding living area, lot size, year built and date of sale constant, with standard errors clustered by subdivision. That removes the neighbourhood, the school district, the builder and the price tier, and leaves the pool.
The number, and what it rests on
Across 2,880 subdivisions containing both kinds of house — 49,314 sales, 10,545 of them with a pool — the premium is +9.6% (CI +9.1 to +10.2, p < 0.001). Against the naive figure with only city controls, +10.6%, it barely moves. Unlike an elevator, a pool survives the within-subdivision test almost intact.
Split it by the price level of the neighbourhood — the median sale price of the subdivision itself, which is a property of the neighbourhood rather than of the individual house:
| Subdivisions where houses sell for | Sales | Pools | Premium | 95% interval |
|---|---|---|---|---|
| Under $300,000 | 9,085 | 711 | +8.4% | +6.8 to +9.9% |
| $300,000 – $500,000 | 25,788 | 4,181 | +9.3% | +8.6 to +10.1% |
| $500,000 – $800,000 | 10,929 | 3,614 | +9.4% | +8.4 to +10.3% |
| $800,000 and up | 3,512 | 2,039 | +8.8% | +7.1 to +10.5% |
All four are significant at p < 0.001, and what is striking is how flat they are. A pool is worth about nine percent of the house almost wherever the house is. The dollars diverge by more than four to one across that range purely because the houses do.
It does rise with the size of the house: +7.4% under 1,800 square feet, +8.6% from 1,800 to 2,600, +10.2% from 2,600 to 3,500, and +10.6% above 3,500 — which is what you would expect if a pool belongs to a certain kind of property rather than to a certain price.
Against what it costs
Percentages are the wrong unit for a decision. Convert them, and put the build cost alongside.
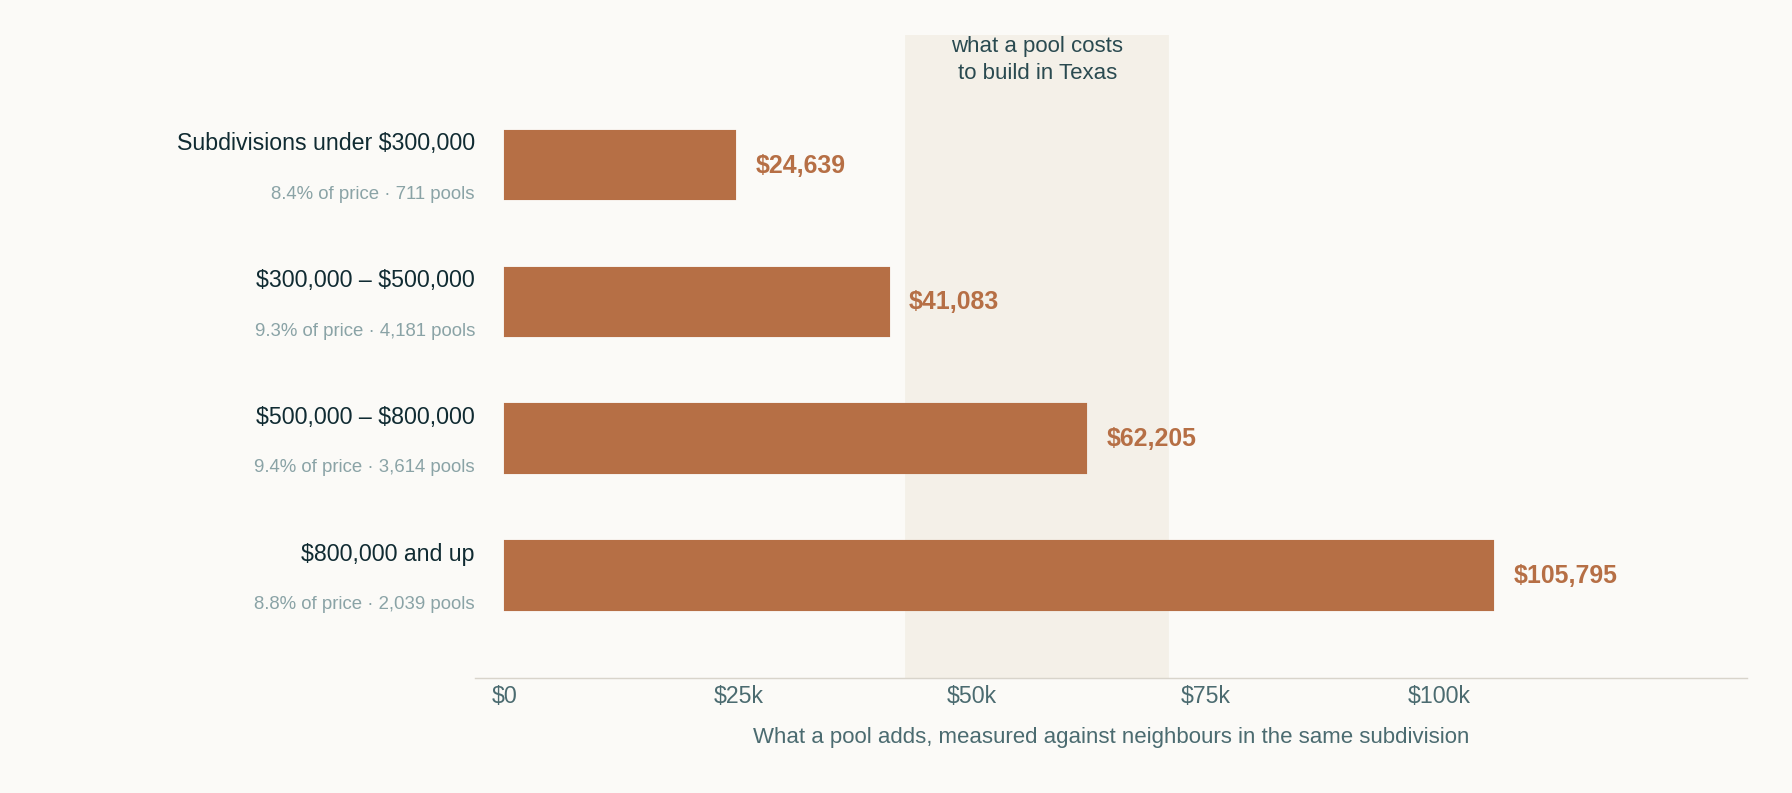
Trade sources put a typical Texas inground pool at $43,000 to $71,000 — roughly $43,000 for vinyl liner, $54,000 fiberglass, $71,000 gunite — with Dallas-area builders quoting from about $50,000 and a 12×24 running $54,000 to $84,000. Expansive clay can add $10,000 to $25,000 before anything else.
So: in the cheapest neighbourhoods a pool returns somewhere between a third and a half of what it costs. In the $300,000 to $500,000 band, about two thirds to all of it depending on how the pool was built. From $500,000 to $800,000 it is at or above cost, and above $800,000 it clears the cost range comfortably.
That is a better return than nearly any other discretionary improvement in this body of work — better than a guest house, far better than solar. It is still not an investment. A pool that returns 100% of its build cost has returned nothing on the ten years of chemicals, electricity, insurance and resurfacing in between.
Who actually has one
The premium is flat. Ownership is anything but.
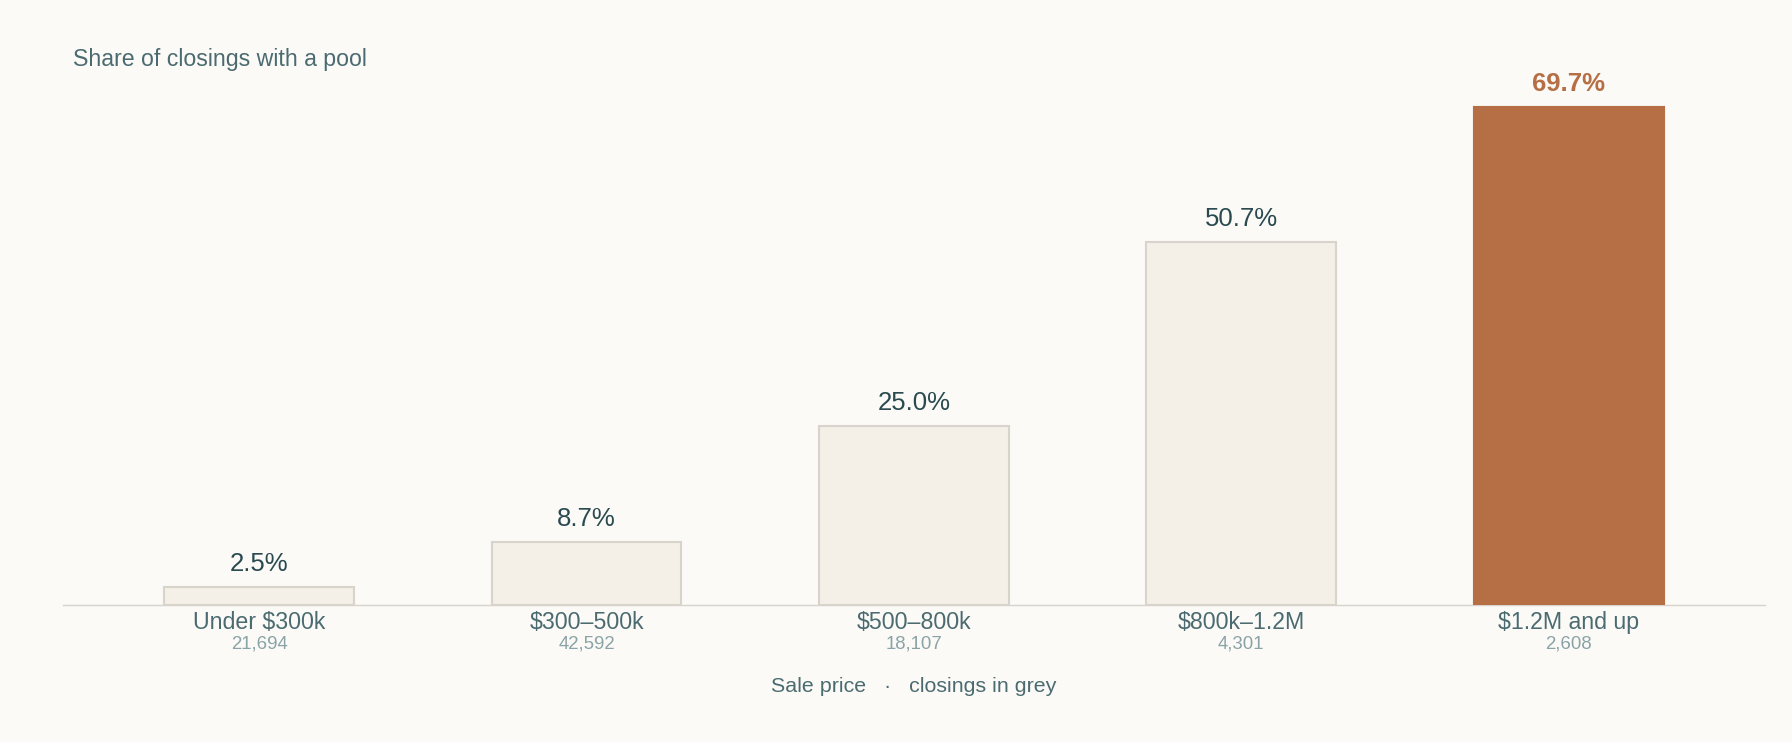
Only 2.5% of closings under $300,000 had a pool. Above $1.2 million, 69.7% did.
That inversion matters for how the question is framed rather than for the number. Above $1.2 million the relevant analysis is usually the penalty for not having a pool rather than the premium for having one — and as I have argued elsewhere, the penalty for lacking a standard feature is frequently the larger figure. Below $300,000 the opposite holds: a pool is unusual, and unusual features price with more variance than an average can show. The 8.4% in that band is an average across 711 pools; individual outcomes in a market where 97.5% of buyers were not looking for one will scatter widely around it.
It also bears on marketability rather than value. A buyer stretching to qualify on a $270,000 house sees the maintenance, the insurance and the fence requirement as costs. The measured premium says the market as a whole still pays for the pool; it does not say every buyer in that band will.
Why the bands are drawn this way
This is technical, and it is here because it changed the answer by a factor of three.
The obvious way to ask whether a pool is worth more in expensive neighbourhoods than cheap ones is to split the sales into bands by sale price and run the model inside each. I did that first. It produced a striking result: below $300,000 a pool appeared to add only 2.4%, about $6,500 — a seventh of what one costs to build. It looked like the cleanest case of superadequacy in the whole dataset.
It was an artefact. Sale price is the thing the model is trying to explain, so splitting on it conditions on the outcome. Inside a band of $250,000 to $300,000, a house that has a pool and still landed in that band must be weaker in some other respect than a pool-less house that landed in the same band — otherwise the pool would have carried it into a higher one. The comparison is rigged against the feature, and the rigging bites hardest at the bottom, where the floor truncates most.
Band instead on the median price of the subdivision — a description of the neighbourhood, settled before any individual house sells — and the bottom band goes from +2.4% to +8.4%. About $6,500 becomes about $24,600. The corrected bands are also consistent with the pooled 9.6%, which the sale-price bands were not; that inconsistency is what sent me looking.
Stratifying comparables by price bracket is ordinary practice, and in a sales-comparison grid it is usually harmless because the analyst is looking at a handful of sales and applying judgment. In a regression across tens of thousands of them it is not harmless: it produces a confident, well-populated, entirely wrong number, and the number looks reasonable on the page. Band on the neighbourhood, the lot, the size, the year — anything but the figure being explained.
I ran the same check on the elevator analysis, where the two methods agree and the conclusion is unaffected, and on accessory units, where they disagree in the same direction as they do here.
Same pool, different neighbourhood
Run the within-subdivision model separately in each market with enough pools to support it. Dollar figures are the premium applied to that market's median closing.
| Market | Pools | Premium | Median close | In dollars |
|---|---|---|---|---|
| Springtown | 72 | +15.1% | $400,000 | $60,464 |
| Decatur | 63 | +14.3% | $444,350 | $63,663 |
| Weatherford | 349 | +13.8% | $448,050 | $61,900 |
| Granbury | 306 | +13.6% | $360,000 | $49,045 |
| Cleburne | 94 | +12.8% | $289,000 | $37,009 |
| Aledo | 205 | +12.3% | $565,950 | $69,613 |
| Waxahachie | 253 | +12.2% | $412,990 | $50,174 |
| Midlothian | 309 | +11.4% | $490,000 | $55,669 |
| Azle | 136 | +11.2% | $335,925 | $37,554 |
| Burleson | 335 | +11.0% | $360,000 | $39,571 |
| Fort Worth | 3,149 | +10.2% | $350,000 | $35,641 |
| Mansfield | 486 | +9.2% | $490,000 | $44,898 |
| Benbrook | 118 | +8.8% | $335,000 | $29,322 |
| Southlake | 506 | +8.4% | $1,355,000 | $113,239 |
| Arlington | 1,137 | +7.9% | $335,000 | $26,287 |
| North Richland Hills | 425 | +7.8% | $385,000 | $30,064 |
| Keller | 627 | +7.7% | $669,500 | $51,783 |
| Colleyville | 415 | +7.1% | $1,005,000 | $71,304 |
| Grapevine | 378 | +6.4% | $589,000 | $37,431 |
| Bedford | 291 | +6.2% | $387,500 | $24,145 |
| Hurst | 185 | +5.3% | $351,500 | $18,686 |
Every one of these is significant at p < 0.05, and the spread between top and bottom is roughly three to one in percentage terms and six to one in dollars — $18,686 in Hurst against $113,239 in Southlake.
The geography is legible. The strongest markets — Springtown, Decatur, Weatherford, Granbury, Aledo, Azle — are the western and rural-fringe markets where lots are large, summers are long and a pool reads as part of the property rather than an addition to it. The weakest are the built-out mid-cities: Hurst, Bedford, Grapevine, Colleyville, where lots are small and pools are common enough to be unremarkable.
Note that percentage and dollars rank differently. Cleburne carries a high percentage and a modest dollar figure because the houses are inexpensive. Southlake is near the bottom on percentage and top on dollars. Which measure matters depends on whether the question is about the adjustment or about the cheque.
This is the concrete answer to why no portable pool adjustment exists. A figure extracted in Hurst, applied in Springtown, is wrong by a factor of nearly three — and it will look entirely reasonable on the page.
What it does to the sale
Price is not the only thing a feature moves. Within the same subdivisions, houses with a pool went under contract in a median 24 days against 32 without, and closed at 97.7% of original list against 97.1%.
Eight days and six tenths of a point is not enormous, but it runs in the opposite direction to the conventional wisdom that a pool narrows the buyer pool and slows the sale. In this market, over this window, it did not. A reasonable reading is that pools concentrate in neighbourhoods and price points where they are expected, so the buyer looking there wants one.
For a seller the practical version: a pool is unlikely to return what it cost, but it is not the liability it is sometimes described as, and it is worth photographing properly and listing in season.
What this does not say
The field is a yes or no. The MLS records that a pool exists, not whether it is a $43,000 vinyl rectangle or a $150,000 gunite installation with a spa, water feature and outdoor kitchen. Everything here is an average across both, which means the premium on a modest pool is overstated and on an elaborate one understated.
Condition is invisible. A twenty-year-old pool needing resurfacing and a new pump is recorded identically to one finished last spring.
Nor is maintenance in any of these figures. Trade sources put routine service at $80 to $150 a month before repairs, resurfacing, higher insurance and the fence a Texas pool requires.
Residual quality is not controlled. Houses with pools tend also to be better finished in ways the MLS does not record, and some unknown part of the 9.6% is that rather than the pool. This is the main reason to treat the figure as an upper bound on what a pool by itself contributes.
The banded figures are grouped by subdivision price level, not by sale price — see the correction for why that distinction changed the answer and what it changed it from.
Terrence Bilodeau is a Certified Residential Appraiser (TX-1360232) and a Texas real estate broker. Clearfork Appraisals provides private-client appraisals in Fort Worth and across Tarrant, Parker, Johnson and Hood counties. This article is a general market study. It is not an appraisal and not a valuation opinion about any specific property.
- North Texas Real Estate Information Systems (NTREIS) closed sales, detached single-family, Dallas–Fort Worth, 2023 – September 2026. 89,302 closings, 12,741 with a pool. Author's analysis; figures reported in aggregate.
- Price a Pool — Texas inground pool cost (vinyl, fiberglass and gunite ranges)
- Anthony & Sylvan — Cost to build a pool in Dallas (local build cost and maintenance)
Cost figures are published ranges from pool builders and are not independent estimates; they are used only as a reference point against the market evidence.