The cliff at year two
Every residential listing carries a tax figure. On a resale it is roughly the bill the next owner will see. On new construction it is something else entirely, and the difference is large enough to break a household budget.
Here is the tax shown on the listing, expressed as a share of what the house actually sold for, sorted by how old the house was on the day it closed. 60,250 closings across Dallas–Fort Worth:
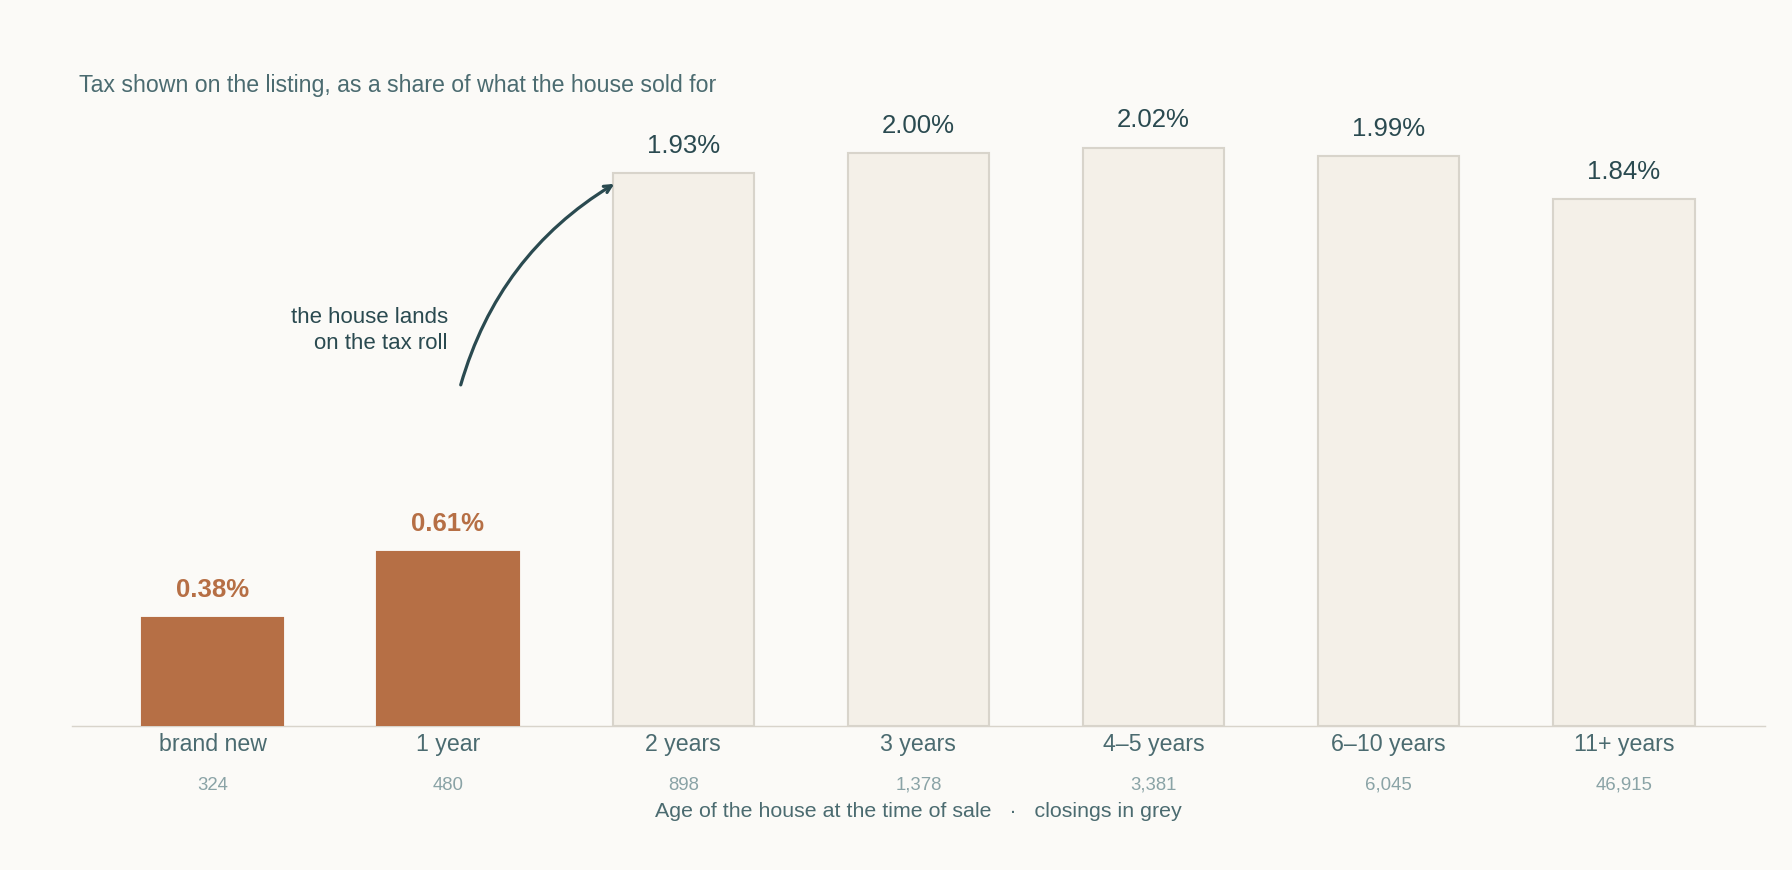
It is not a ramp. It is a cliff, and it falls in the same place every time.
A house that sold the year it was built shows a tax bill of 0.38% of its price. At one year old, 0.61%. At two years old, 1.93% — and it stays between 1.84% and 2.02% from there on, for as long as the house stands.
The mechanism is not mysterious. Texas appraisal districts assess as of January 1. A house framed in March and closed in September was a vacant lot on the assessment date, so the tax record reflects dirt. The following January the improvement is on the roll, and the bill becomes a real one.
The listing shows the lot’s bill. The lender escrows against something close to it. The first full year arrives, the district assesses the house, and the escrow analysis comes back asking for several hundred dollars a month more — plus a shortage for the months already underpaid.
What it costs, in dollars
Take the median new build in this data at $450,000.
| Effective rate | Annual tax | Monthly | |
|---|---|---|---|
| Shown on the listing | 0.46% | $2,054 | $171 |
| Once the house is assessed | 1.86% | $8,362 | $697 |
| Difference | +1.40 pts | +$6,308 | +$526 |
Five hundred and twenty-six dollars a month is not a rounding error. At a 6.5% mortgage rate it is the payment difference between a $450,000 house and a $533,000 one. A buyer who qualified at the edge of their comfort on the listed figure did not qualify for the house they bought.
This is the single most useful thing in this article, and it costs nothing to act on: before writing an offer on new construction, ask the county appraisal district what the assessment will be once the improvement is on the roll, and budget the payment from that figure rather than from the listing.
What the rate actually is, market by market
Strip out anything under six years old, so every house in the sample has been fully assessed for years, and the differences between markets come into focus.
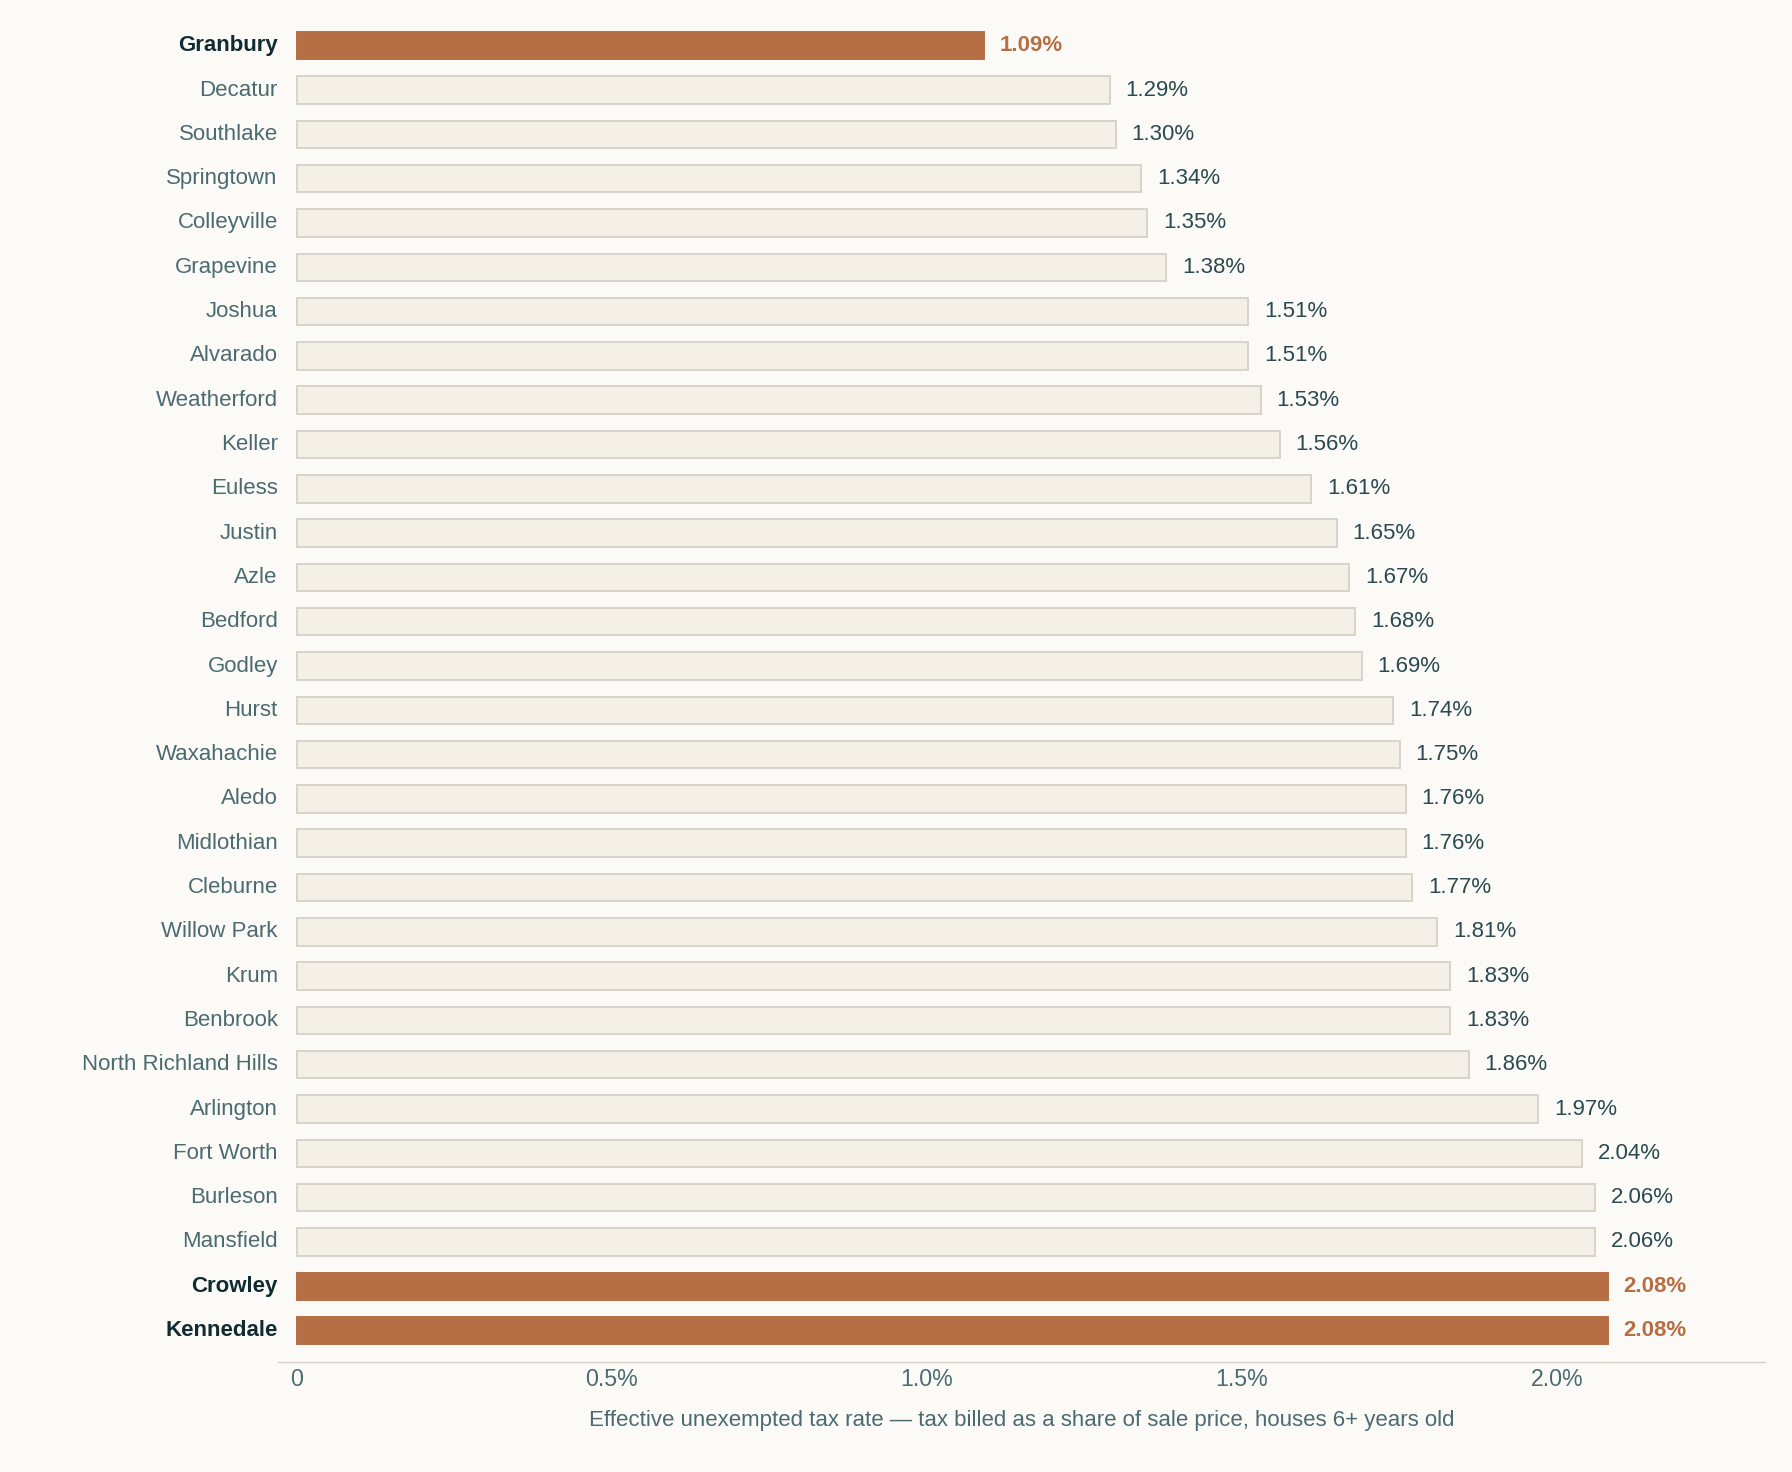
The range is 1.09% to 2.08%. On a $400,000 house that is $4,360 a year against $8,320 — a difference of $3,934, or $328 a month, for the same house in two markets an hour apart.
Granbury sits alone at the bottom. Decatur, Southlake, Springtown, Colleyville and Grapevine follow between 1.29% and 1.38%. At the top, six markets cluster above 1.97%: Arlington, Fort Worth, Burleson, Mansfield, Crowley and Kennedale.
Rates move every year as jurisdictions adopt new ones, and a single address can sit in a different combination of city, county, school, college, hospital and special districts than its neighbour two streets away. These are market-level medians, not a rate you can apply to an address.
Low tax does not mean cheap
There is a common assumption that low-tax suburbs are the affordable ones. Across these 30 markets, rate and median price run mildly in opposite directions — a correlation of about −0.44. The low-rate end of the table holds Southlake at a $1.31 million median and Colleyville at $979,000.
What that actually reflects is the arithmetic of ad valorem taxation. A jurisdiction with a large, expensive tax base can fund itself at a lower rate. A jurisdiction with a modest base cannot. So a low rate is frequently a symptom of expensive housing rather than a discount on it.
Which makes the genuine exception worth naming. Granbury carries the lowest rate in the sample at 1.09% on a $392,500 median — low rate and moderate price together. Decatur at 1.29% on $400,000 and Springtown at 1.34% on $365,000 are the other two.
The useful comparison is never the rate on its own. It is principal, interest and tax together, because that is what the household actually pays.
Why this matters inside an appraisal
Three practical consequences.
A new-construction comparable carries a tax figure that is not comparable. Anyone reading a grid, a listing history or a data pull that includes assessed taxes is looking at land-only figures on the new-build rows and fully-assessed figures on the resale rows. They are different quantities wearing the same label.
The appraisal district’s value is not an opinion of market value. It is produced by mass appraisal for taxation, as of a statutory assessment date, without an interior inspection. A district value that is higher or lower than a market value opinion is not evidence that either is wrong — they are different exercises with different definitions, and the gap between them is the ordinary state of affairs rather than a discrepancy.
Which is what a protest actually turns on. A tax protest is not an argument that the district was careless. It is an argument about what the property was worth on January 1 of the tax year, supported by market evidence as of that date. That is a retrospective valuation with a fixed effective date, and it either rests on comparable sales analysed properly or it does not.
What “unexempted” means and why I used it
Every rate in this article is the unexempted tax — the bill before a homestead exemption, an over-65 or disability exemption, a disabled veteran exemption, or any local option exemption — divided by the price the house actually sold for.
So these figures are higher than what a homesteaded owner-occupant pays. That is deliberate, and it is the only basis on which markets can be compared, because exemptions attach to the owner rather than to the property. Two identical houses across the street from each other carry different bills depending on who lives in them and how old they are. Strip the exemptions out and you are comparing the jurisdictions instead of the residents.
To translate any figure here into a likely bill, subtract the exemptions that apply to the specific owner — which the county appraisal district can tell you, and which your tax advisor should confirm.
What this does not say
These are medians, not rates. Every figure is derived from what was billed against what sold, across a whole market. A single address sits in its own combination of taxing jurisdictions and may land well off the market median.
Rates change annually. These describe closings from 2023 through September 2026. Jurisdictions adopt new rates every year, and the legislature changes exemptions periodically.
The new-construction finding is about the assessment calendar, not about any builder. Nothing here suggests anyone is concealing anything. The listing reports the tax record that exists, and on a new house that record describes a vacant lot.
And none of this is tax advice. It is a market study of what was billed against what sold.
Terrence Bilodeau is a Certified Residential Appraiser (TX-1360232) and a Texas real estate broker. Clearfork Appraisals provides private-client appraisals in Fort Worth and across Tarrant, Parker, Johnson and Hood counties, including retrospective valuations for ad valorem protest. This article is a general market study. It is not an appraisal, not tax advice, and not a valuation opinion about any specific property.
- North Texas Real Estate Information Systems (NTREIS) closed sales with an assessed-tax figure of record, Dallas–Fort Worth, 2023 – September 2026. 60,250 closings. Author's analysis; figures reported in aggregate.
- Texas Comptroller — Property tax exemptions
- TALCB — Appraisal, Evaluation, Broker’s Price Opinion: What’s the Difference?
Rates are derived from the assessed tax of record against the actual sale price, before exemptions. They are not published jurisdictional rates and should not be used in place of them. Confirm any specific figure with the county appraisal district and your tax advisor.